Fig. 7.
Download original image
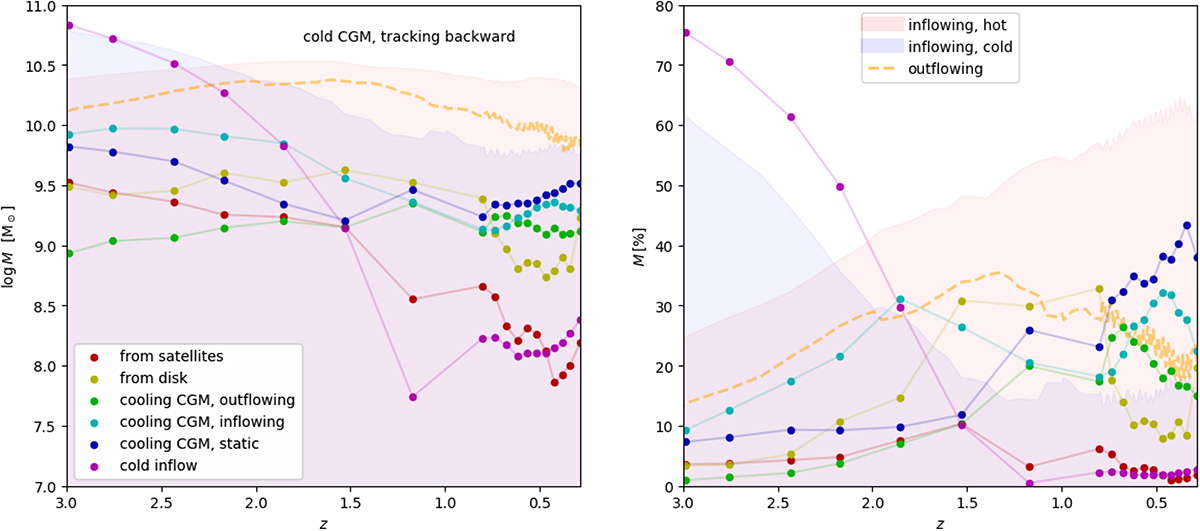
Origin of cold CGM gas at different redshifts. For each snapshot at a given redshift z, the gas particles in the cold CGM are tracked back until their origin is identified (according to the sketch in Fig. 2). Left: colored points at a given z representing the total mass of particles having a particular origin, as in the legend. The shaded blue and red areas show the total cold and hot inflowing gas mass, respectively. The orange dashed lines represents the total outflowing gass mass. Right: same as the left panel, but the points represent the fraction of gas mass with respect to the initial mass of the cold CGM that is tracked back at a given redshift. In a similar fashion, the inflowing and outflowing gas are represented as a fraction.
Current usage metrics show cumulative count of Article Views (full-text article views including HTML views, PDF and ePub downloads, according to the available data) and Abstracts Views on Vision4Press platform.
Data correspond to usage on the plateform after 2015. The current usage metrics is available 48-96 hours after online publication and is updated daily on week days.
Initial download of the metrics may take a while.