Fig. 5.
Download original image
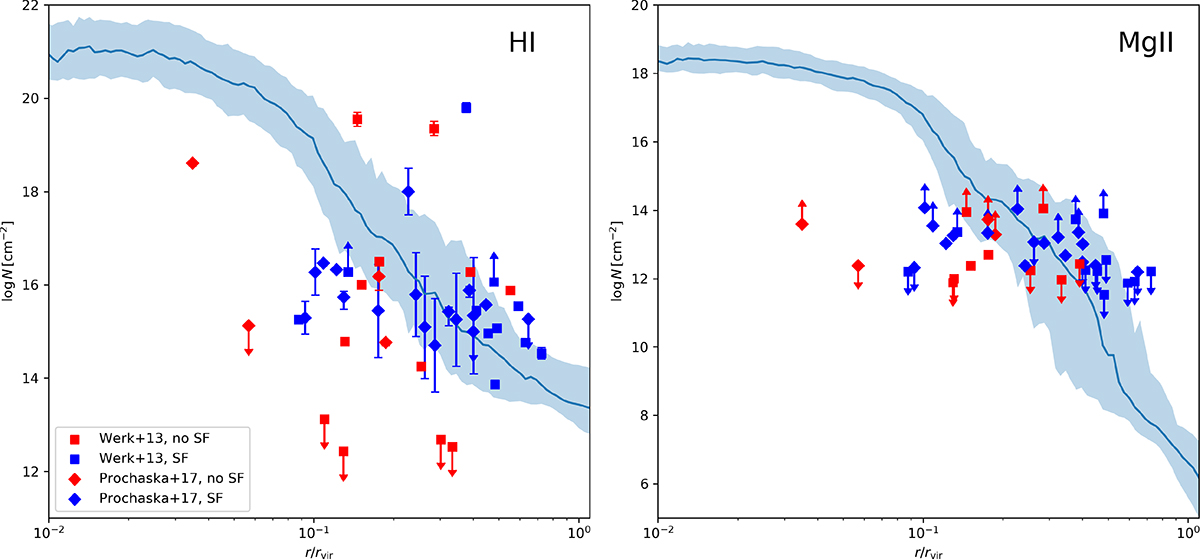
Radial profiles of HI (left) and MgII (right) column densities, averaging over annuli of thickness 0.5 kpc. The solid line represents the median value, and the shaded region includes the variation from the 10th to the 90th percentile. The observational data from the COS-Halos survey are overplotted, distinguishing between star-forming (blue squares) and non-star-forming (red diamonds) galaxies. The arrows indicate upper and lower limits.
Current usage metrics show cumulative count of Article Views (full-text article views including HTML views, PDF and ePub downloads, according to the available data) and Abstracts Views on Vision4Press platform.
Data correspond to usage on the plateform after 2015. The current usage metrics is available 48-96 hours after online publication and is updated daily on week days.
Initial download of the metrics may take a while.