Fig. 3.
Download original image
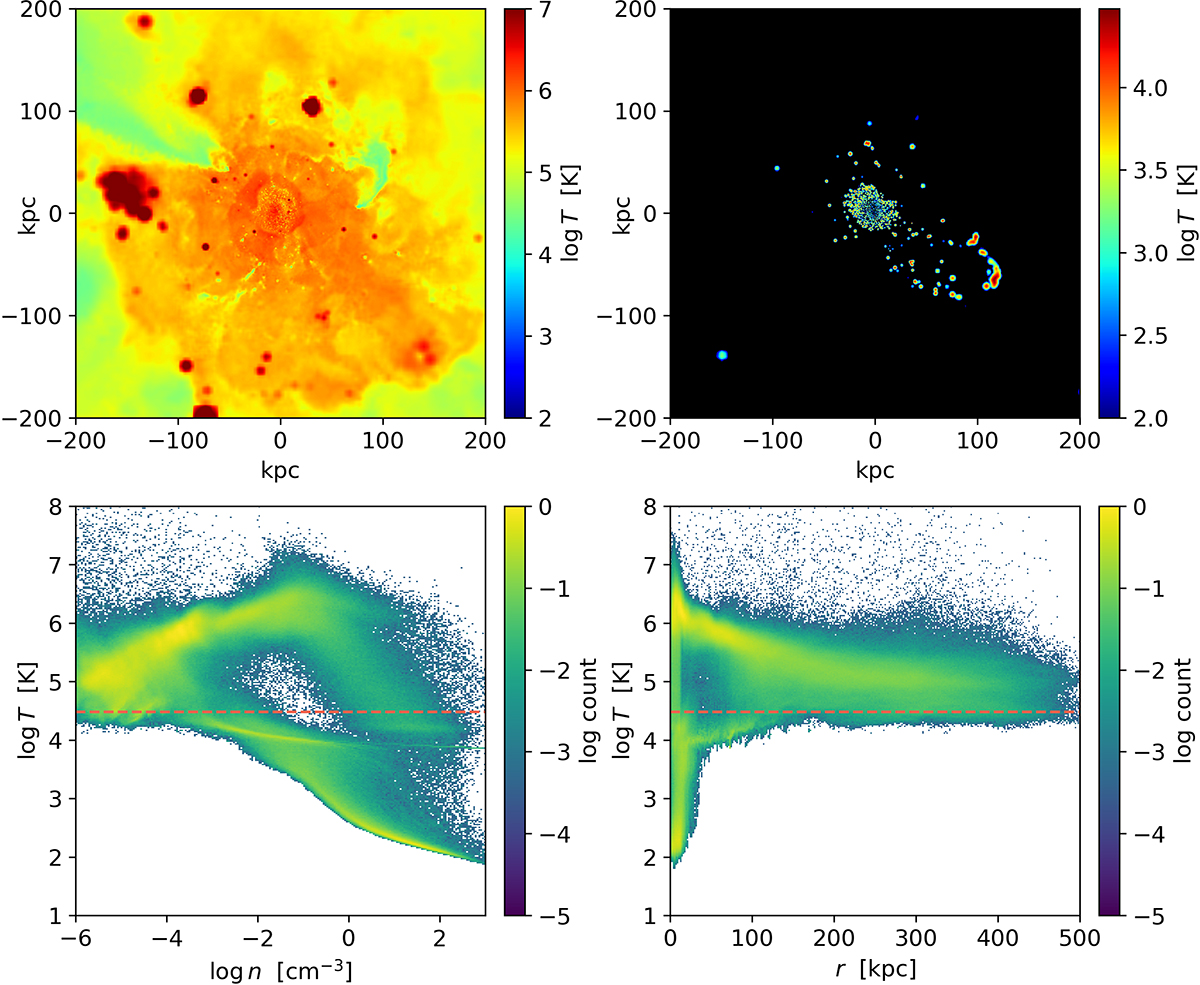
Overview of Eris2k gas temperature at z ≃ 0.3. Upper left: temperature map on a slice of gas that passes through the halo center. Small green patches of gas with temperatures lower than 105 K are visible, ubiquitous, and present especially in the central region within 100 kpc. Upper right: only gas with temperature T < 3 × 10⁴ K is shown from the same slice. Most of the cold gas is located in the central area, and large bubbles are also present at greater distances. Lower left: distribution of the gas in the whole box in the density-temperature diagram; the red line marks the threshold temperature T = 3 × 10⁴ K. Lower right: distribution in the radial distance–temperature diagram.
Current usage metrics show cumulative count of Article Views (full-text article views including HTML views, PDF and ePub downloads, according to the available data) and Abstracts Views on Vision4Press platform.
Data correspond to usage on the plateform after 2015. The current usage metrics is available 48-96 hours after online publication and is updated daily on week days.
Initial download of the metrics may take a while.