Fig. 16.
Download original image
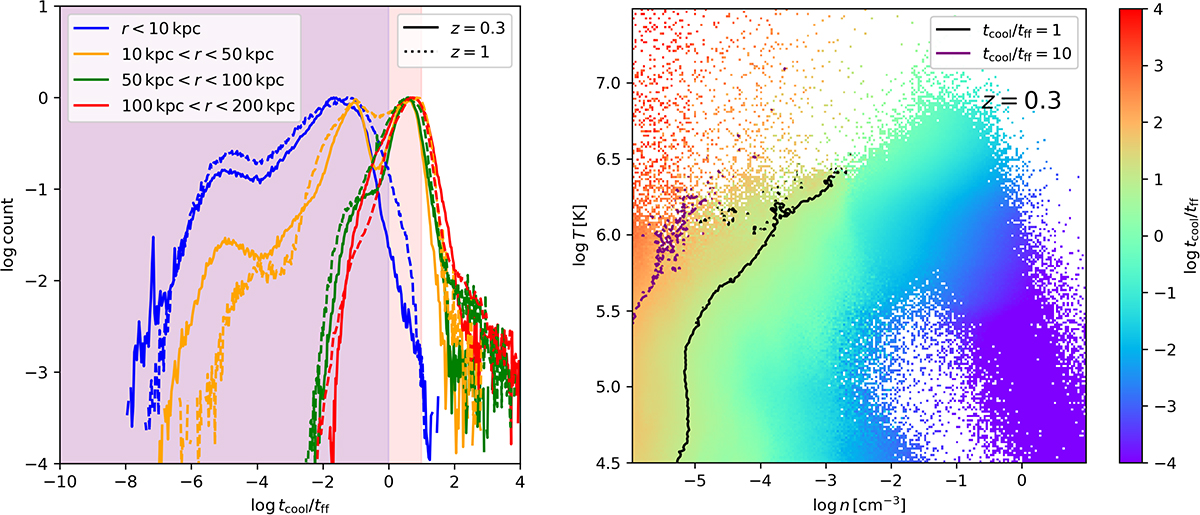
Properties of the hot (T > 3 × 10⁴ K) CGM gas according to its tcool/tff ratio. Left: distribution of tcool/tff at two different redshifts, z = 0.3 (solid line) and z = 1 (dashed line). The different colors indicate gas belonging to different radial distance bins, while the shaded regions highlight the tcool/tff < 1 criterion for precipitation-regulated feedback, and the less stringent tcool/tff < 10 condition. Right: distribution of hot CGM gas at z = 0.3 in the n-T phase diagram, color-coded by the average value of tcool/tff. The contour lines show the tcool/tff = 1 and 10 boundaries.
Current usage metrics show cumulative count of Article Views (full-text article views including HTML views, PDF and ePub downloads, according to the available data) and Abstracts Views on Vision4Press platform.
Data correspond to usage on the plateform after 2015. The current usage metrics is available 48-96 hours after online publication and is updated daily on week days.
Initial download of the metrics may take a while.