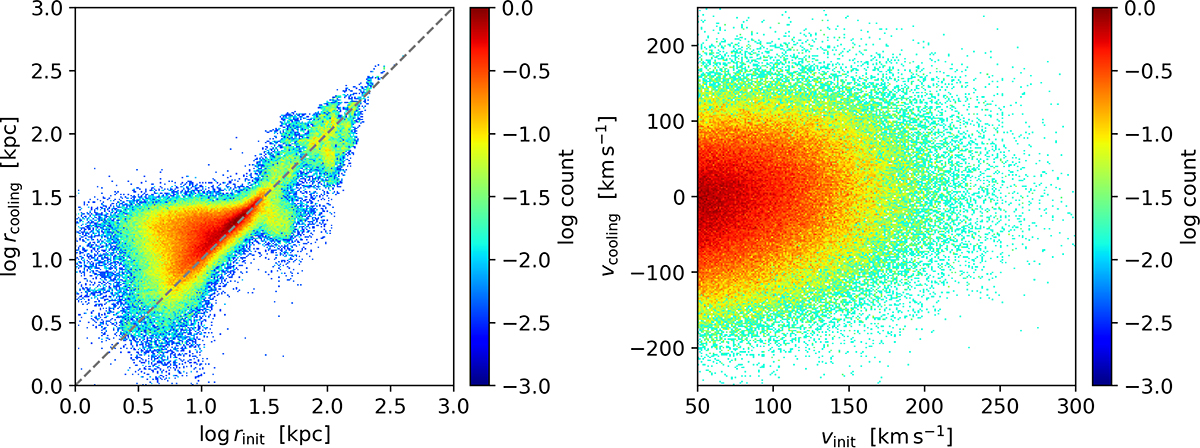
Fig. 13.
Download original image
Evolution of hot outflowing gas: Hot outflowing gas is tracked forward from z ≃ 0.5 until it cools down. The two panels show the mass-weighted particle distribution according to their initial radius (rinit) and the radius at which they cool down (rcooling) in the left panel, and according to their initial radial velocity (vinit) and the velocity at which they cool down (vcooling) in the right panel. The two panels show the distribution of particles, weighted by their mass, according to their initial radius (x-axis), and the radius at which they cool down (y-axis).
Current usage metrics show cumulative count of Article Views (full-text article views including HTML views, PDF and ePub downloads, according to the available data) and Abstracts Views on Vision4Press platform.
Data correspond to usage on the plateform after 2015. The current usage metrics is available 48-96 hours after online publication and is updated daily on week days.
Initial download of the metrics may take a while.