Fig. 1.
Download original image
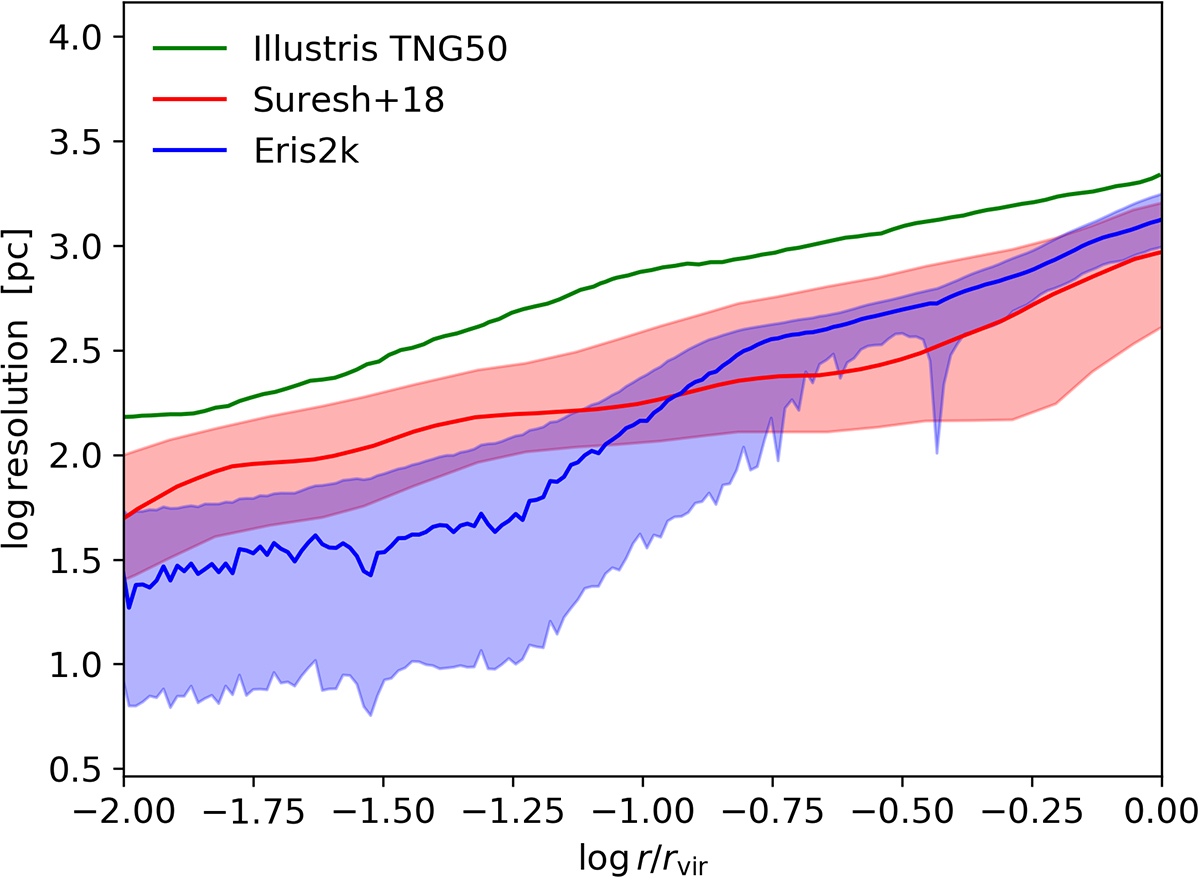
Gas resolution (defined as the smoothing length of SPH particles) in the simulation Eris2k as a function of distance from the main halo center. The blue curve represents the median value in the radial bin, while the shaded area includes the variation from the 10th to the 90th percentile. The other two lines show the median resolution for a halo in Illustris TNG50 (Mhalo ≃ 1012.5 M⊙) and the high-resolution simulation in Suresh et al. (2019; with 10th to 90th percentile variation).
Current usage metrics show cumulative count of Article Views (full-text article views including HTML views, PDF and ePub downloads, according to the available data) and Abstracts Views on Vision4Press platform.
Data correspond to usage on the plateform after 2015. The current usage metrics is available 48-96 hours after online publication and is updated daily on week days.
Initial download of the metrics may take a while.