Fig. 9
Download original image
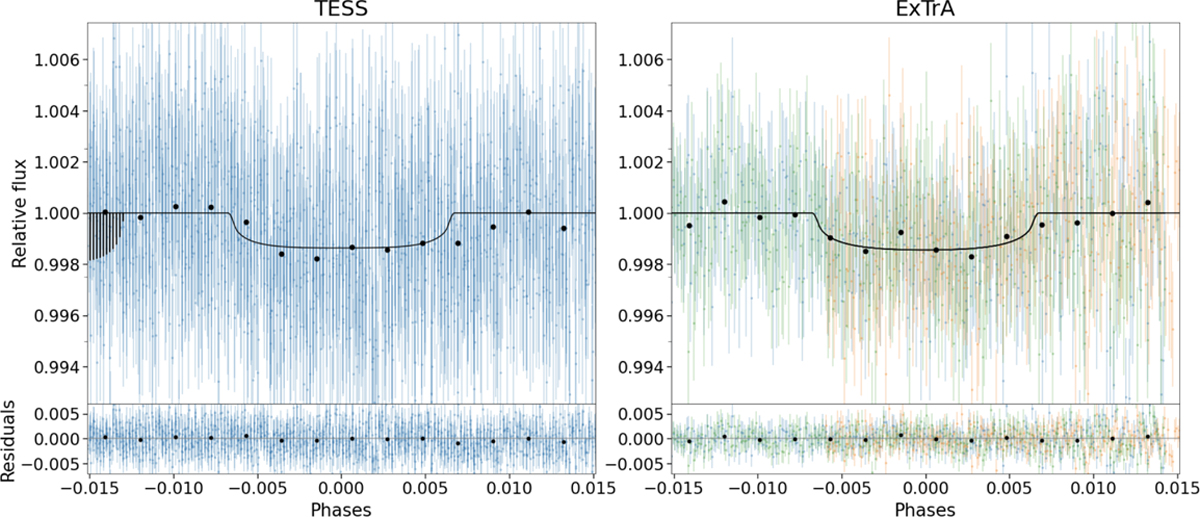
Phase-folded light curves for TOI-663 d for the TESS photometry (seven transits) and ExTrA photometry (two transits, one with one telescope and the other with two telescopes). The black line is the maximum a posteriori model, the black points are data binned to one-sixth of the transit duration. The dark area to the left on the far right plot is due to the transit of the other exoplanets that happened close to the transit of TOI-663 d.
Current usage metrics show cumulative count of Article Views (full-text article views including HTML views, PDF and ePub downloads, according to the available data) and Abstracts Views on Vision4Press platform.
Data correspond to usage on the plateform after 2015. The current usage metrics is available 48-96 hours after online publication and is updated daily on week days.
Initial download of the metrics may take a while.