Fig. 6
Download original image
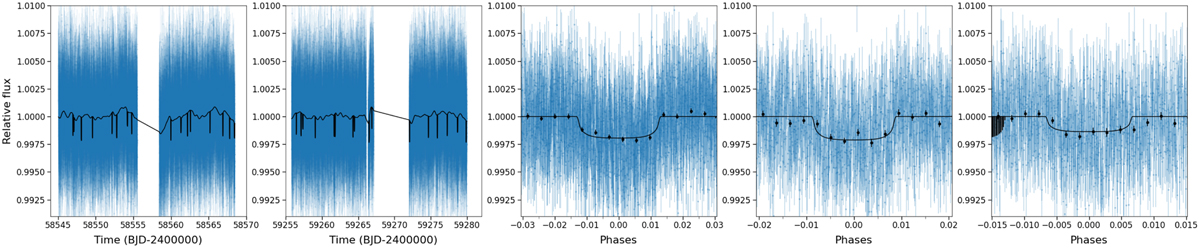
Modeling of the TESS data. Two left panels: TESS photometry time series from Sectors 9 and 35 along with the maximum a posteriori (solid black line). Three right panels: phase-folded light curve to the period of the planet (black points correspond to one-sixth of the transit duration for each planet). The three panels are associated with the b, c, and d planets, respectively. The dark area to the left on the far right plot is due to the transit of the other exoplanets that happened close to the transit of TOI-663 d.
Current usage metrics show cumulative count of Article Views (full-text article views including HTML views, PDF and ePub downloads, according to the available data) and Abstracts Views on Vision4Press platform.
Data correspond to usage on the plateform after 2015. The current usage metrics is available 48-96 hours after online publication and is updated daily on week days.
Initial download of the metrics may take a while.