Open Access
Fig. 1
Download original image
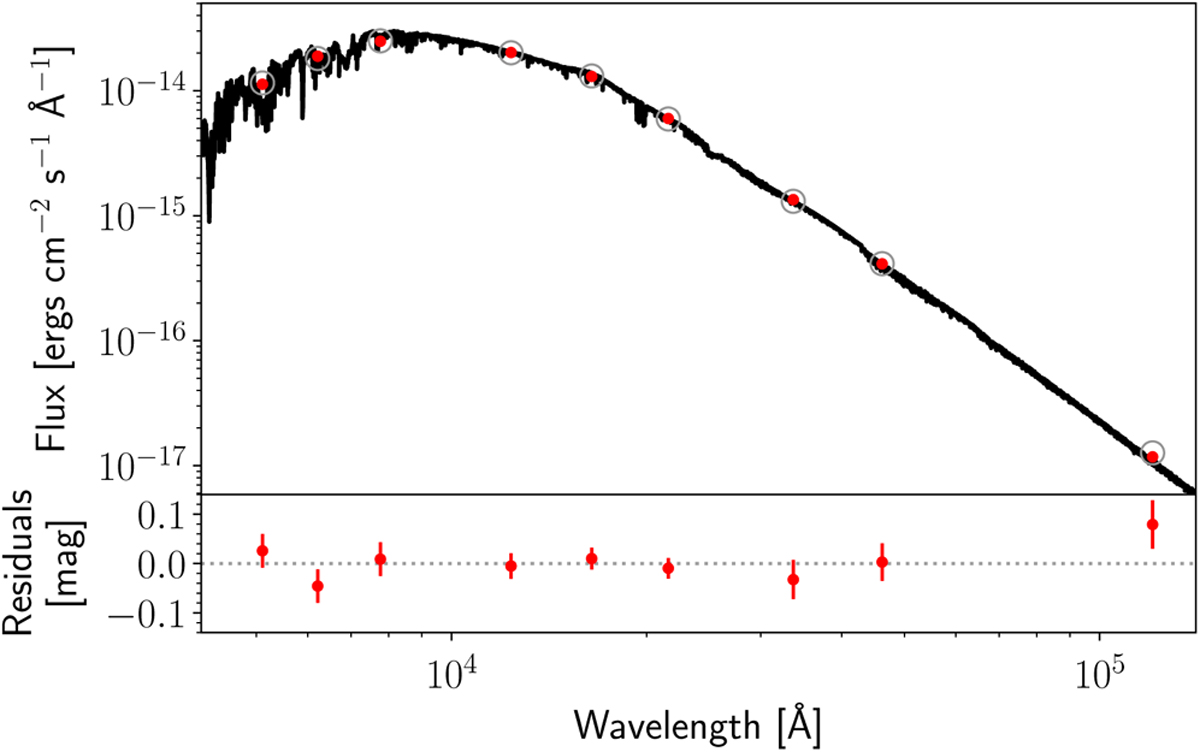
SED of TOI-663. The solid line is the maximum a posteriori PHOENIX/BT-Settl interpolated synthetic spectrum, red circles are the absolute photometric observations, and gray open circles are the result of integrating the synthetic spectrum in the observed bandpasses.
Current usage metrics show cumulative count of Article Views (full-text article views including HTML views, PDF and ePub downloads, according to the available data) and Abstracts Views on Vision4Press platform.
Data correspond to usage on the plateform after 2015. The current usage metrics is available 48-96 hours after online publication and is updated daily on week days.
Initial download of the metrics may take a while.