Fig. 5.
Download original image
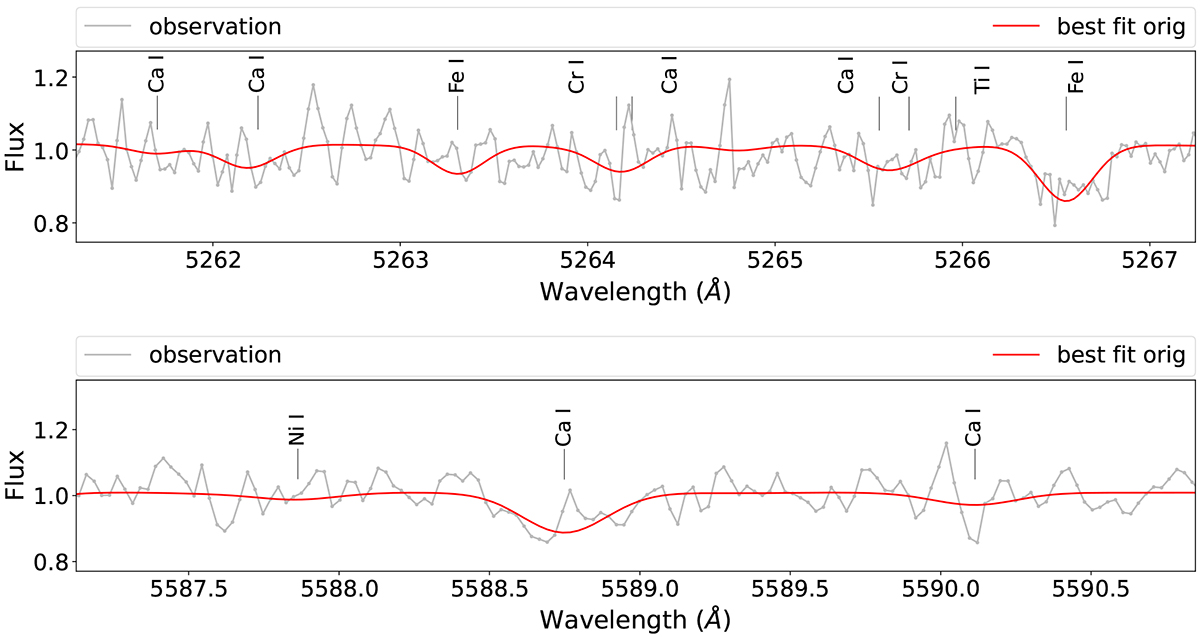
Examples of a couple of spectral windows used to derive Ca. Top: spectral window containing a number of Ca I lines ranging from 5261.0–5266.0 Å with the presence of other elements such as Fe I, Ti I, and Cr I. Bottom: spectral region of Ca I lines at 5588.7 Å and 5590.1 Å. The best-fit model is in red and the observed spectrum is in grey.
Current usage metrics show cumulative count of Article Views (full-text article views including HTML views, PDF and ePub downloads, according to the available data) and Abstracts Views on Vision4Press platform.
Data correspond to usage on the plateform after 2015. The current usage metrics is available 48-96 hours after online publication and is updated daily on week days.
Initial download of the metrics may take a while.