Open Access
Fig. 3.
Download original image
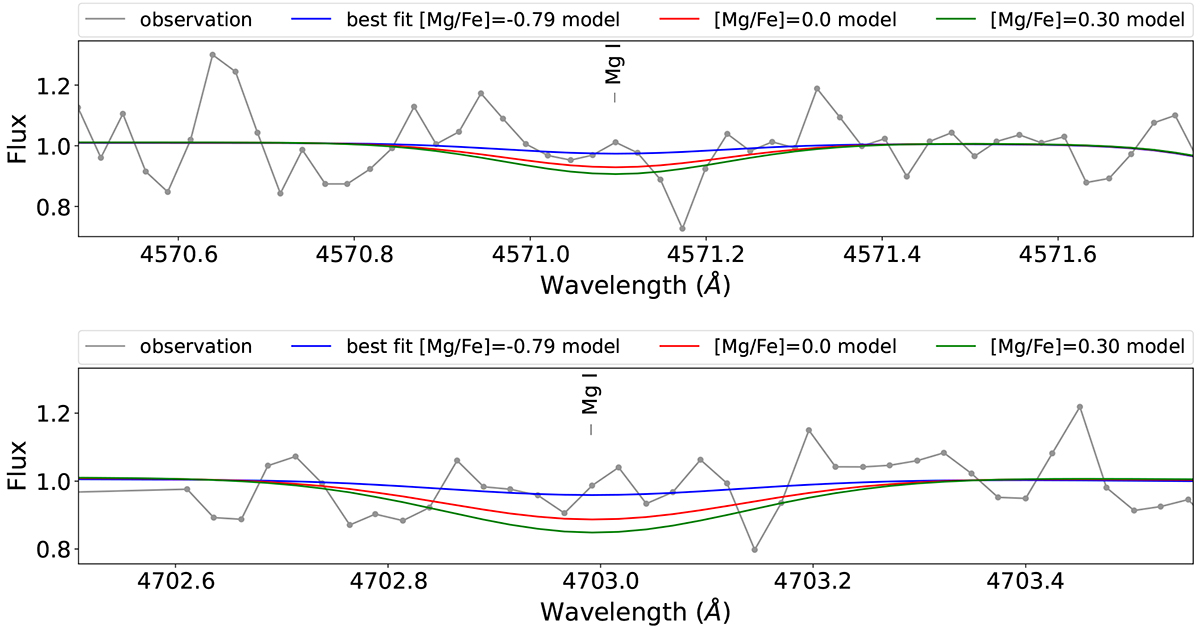
Variation in [Mg/Fe] test. Top: spectral window of the Mg I line at 4571 Å. Bottom: spectral window of the Mg I line at 4703 Å. The best-fit model is in blue, the solar value of [Mg/Fe] is in red, the enhanced [Mg/Fe] abundance is in green, and the observed spectrum is in grey.
Current usage metrics show cumulative count of Article Views (full-text article views including HTML views, PDF and ePub downloads, according to the available data) and Abstracts Views on Vision4Press platform.
Data correspond to usage on the plateform after 2015. The current usage metrics is available 48-96 hours after online publication and is updated daily on week days.
Initial download of the metrics may take a while.