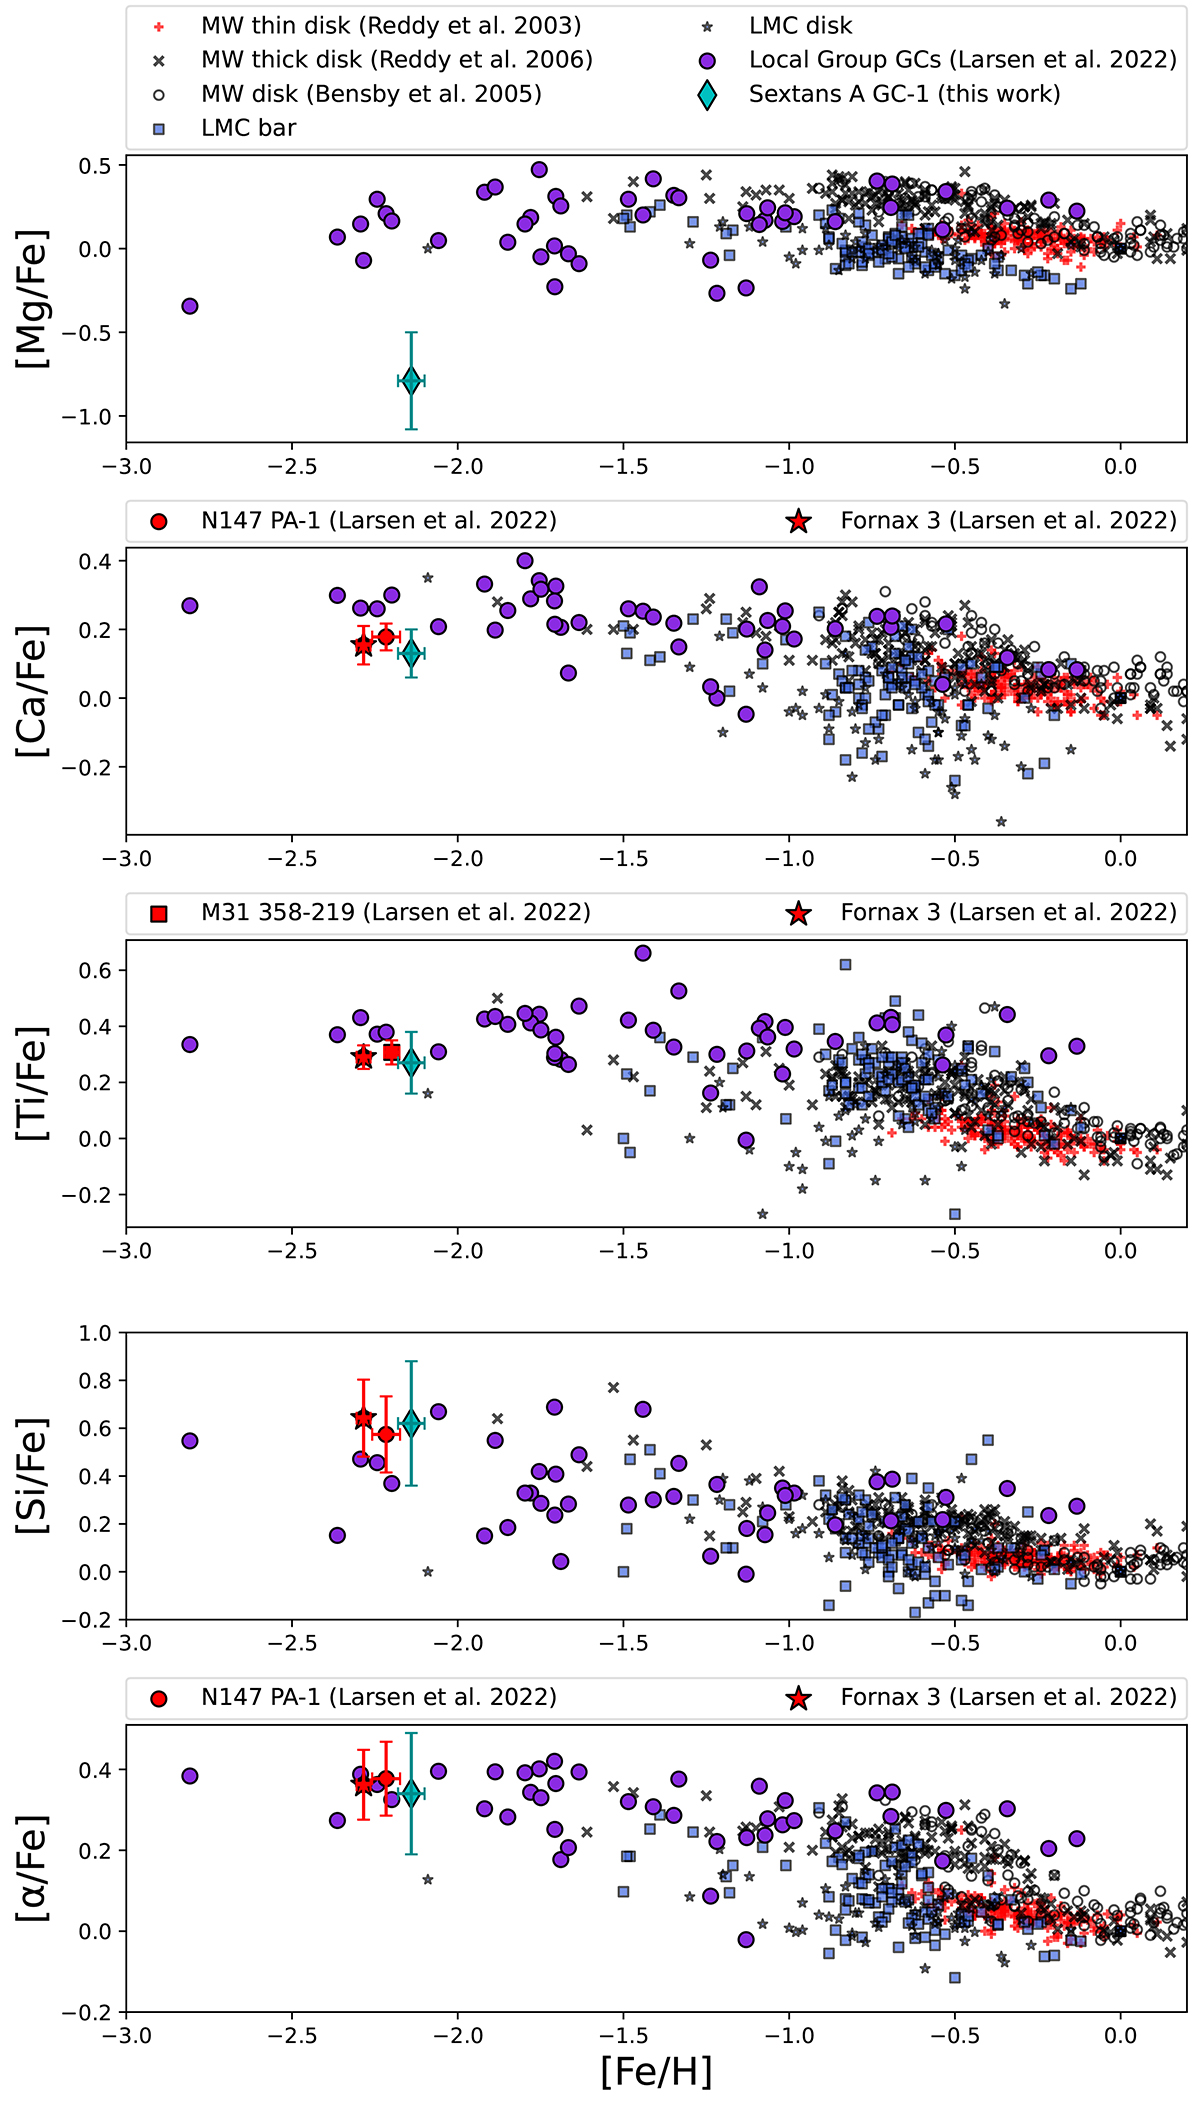
Fig. 2.
Download original image
Individual α elements plotted against iron abundance, [Fe/H]. Top: [Mg/Fe] vs. [Fe/H]. Second row: [Ca/Fe] vs. [Fe/H]. Third row: [Ti/Fe] vs. [Fe/H]. Fourth row: [Si/Fe] vs. [Fe/H]. Bottom: [⟨Si, Ca, Ti⟩/Fe] vs. [Fe/H]. Turquoise rhombus refers to this work. Purple circles show the NLTE abundance of the GCs in the Local Group from Larsen et al. (2022); some of these Local Group GCs are highlighted in red symbols and introduced in the legends accordingly, e.g. N147 PA-1 is a red circle, Fornax 3 is a red star, M31 358-219 is a red square, and red crosses and black Xs present MW disc abundances from Reddy et al. (2003, 2006), respectively. Black open circles are the MW disc abundances from Bensby et al. (2005). Blue squares and stars belong to LMC bar and inner disc abundances presented by Van der Swaelmen et al. 2013).
Current usage metrics show cumulative count of Article Views (full-text article views including HTML views, PDF and ePub downloads, according to the available data) and Abstracts Views on Vision4Press platform.
Data correspond to usage on the plateform after 2015. The current usage metrics is available 48-96 hours after online publication and is updated daily on week days.
Initial download of the metrics may take a while.