Fig. 9

Download original image
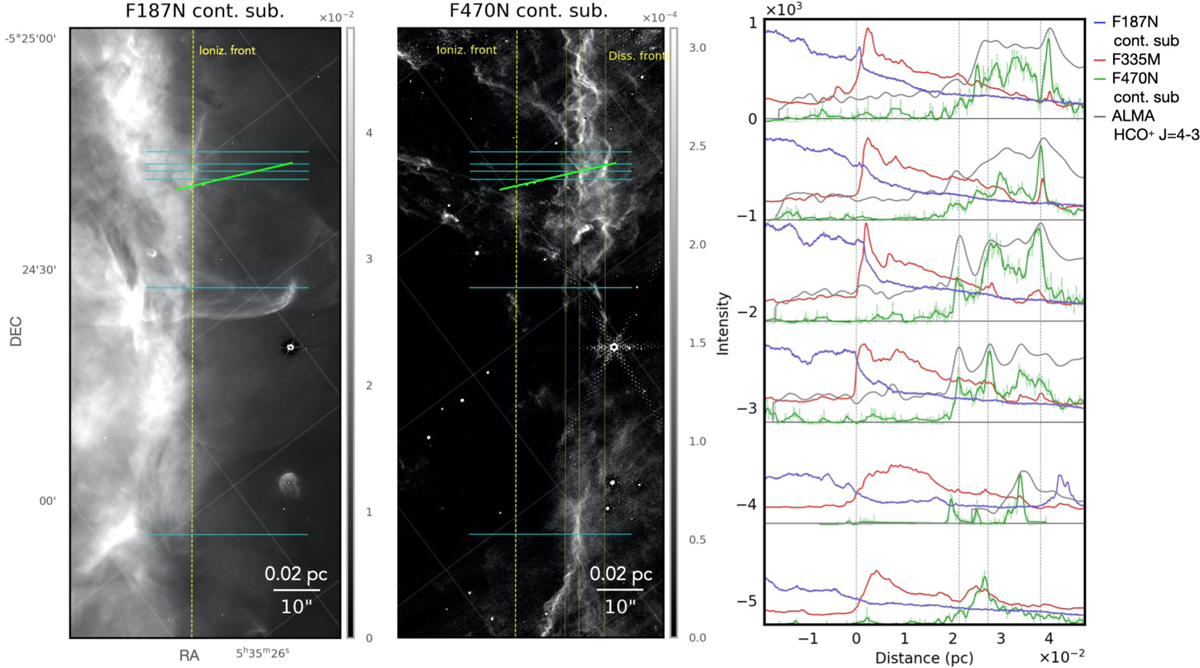
Spatial distribution of the ionized and excited dense molecular gas. Left: maps in the F187N filter (Pa α line) and in the F470N filter continuum subtracted (H2 0–0 S(9) line). Same as Fig. 6 for the vertical and horizontal lines. Vertical dotted lines in the F470N filter continuum subtracted show the DFs position as determined in Sect. 5.2.1. Units are in erg cm−2 s−1 sr−1. Right: Surface brightness profiles of the Pa α (in blue) and H2 0–0 S(9) line (in green) as a function of the distance from the IF. The profiles of the lines are normalized to the surface brightness profiles of the F335M filter (in red). The intensities have not been corrected for dust extinction. The ALMA HCO+ J = 4−3 line integrated intensity profile is shown in grey. The vertical dotted-dashed lines indicate the average position of the IF and the DFs, also indicated by yellow lines in the left panels.
Current usage metrics show cumulative count of Article Views (full-text article views including HTML views, PDF and ePub downloads, according to the available data) and Abstracts Views on Vision4Press platform.
Data correspond to usage on the plateform after 2015. The current usage metrics is available 48-96 hours after online publication and is updated daily on week days.
Initial download of the metrics may take a while.


