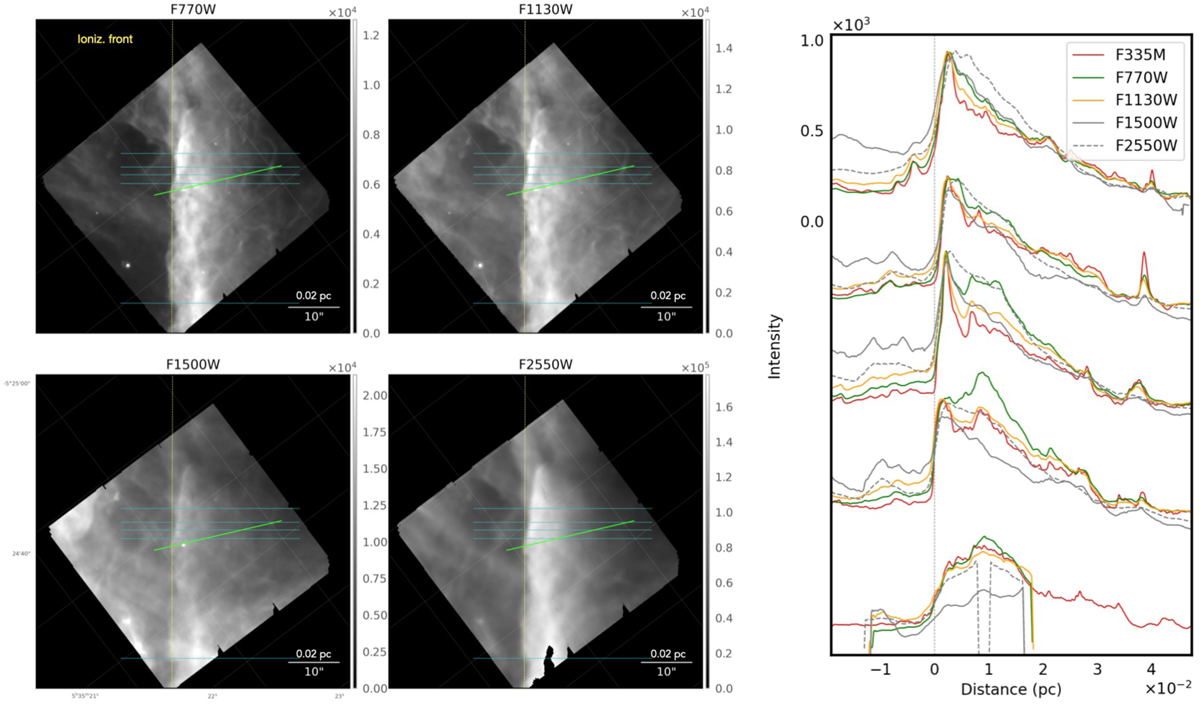
Fig. 8

Download original image
Spatial distribution of the MIRI filters tracing the AIBs at 7.7 and 11.3 µm and continuum dust emission. Left: Maps in the MIRI filters. Same as Fig. 6 for the vertical and horizontal lines. Right: Surface brightness profiles of the F335M NIRCam filter (in red), and F770W (in green), F1130W (in yellow), F1500W (solid grey) and F2550W (dashed grey) MIRI filters as a function of the distance from the IF. In order to compare the brightness profiles along each cut in the Bar, the mean emission background in front of the Bar (face-on background PDR contribution) has been subtracted to each filter’s cut and then scaled to the NIRCam F335M filter maximum amplitude. The background emission level subtracted to the profiles is about 160, 1700, 3200, 4900, 34000 MJy sr−1 for the F335M, F770W, F1130W, F1500W and F2500W filters, respectively. The vertical dotted-dashed line indicates the average position of the IF, also indicated by yellow line in the left panel.
Current usage metrics show cumulative count of Article Views (full-text article views including HTML views, PDF and ePub downloads, according to the available data) and Abstracts Views on Vision4Press platform.
Data correspond to usage on the plateform after 2015. The current usage metrics is available 48-96 hours after online publication and is updated daily on week days.
Initial download of the metrics may take a while.


