Fig. 6

Download original image
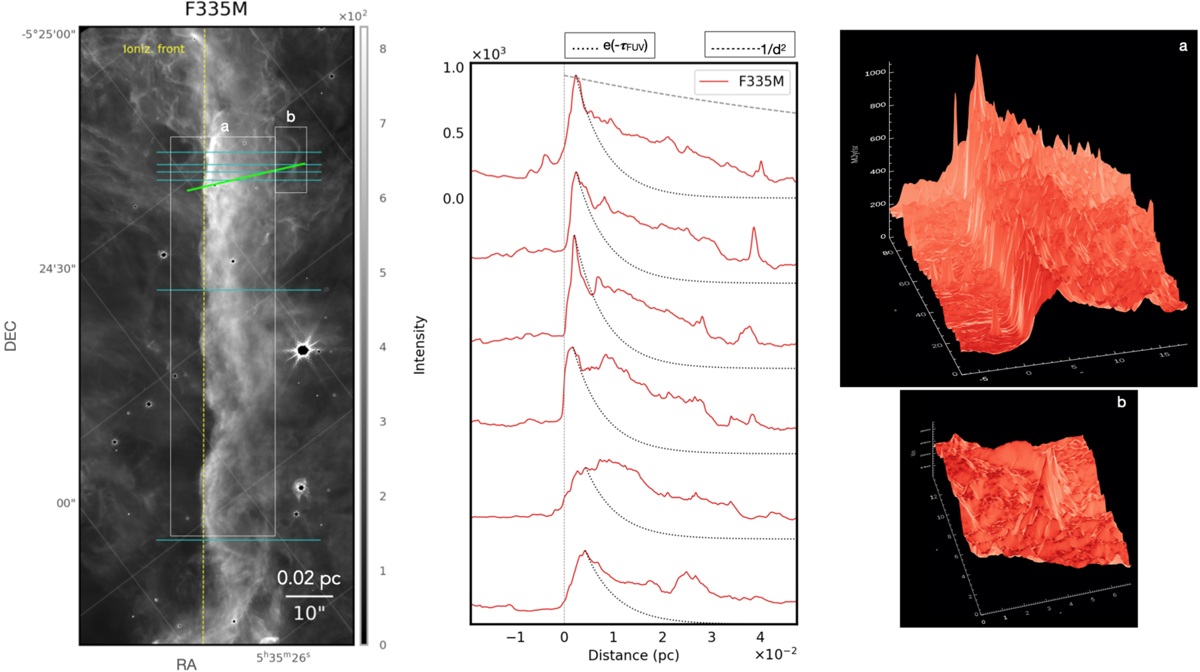
Spatial distribution of the F335M filter tracing mostly the AIBs CH stretch emission in the 3.17–3.54 µm range. Left: map in the F335M filter centered on the Bar and rotated so that the ionizing radiation strikes the Bar from the left. Units are in MJy sr−1. The vertical dashed line (in yellow) delimits the average position of the IF. The horizontal lines (in cyan) give the position of 6 cuts, perpendicular to the Bar (the top cut toward the south), displayed in the middle panel. the inclined line (in green) gives the position of the cut obtained from the NIRSpec field, shown in Fig. 11. The boxes (in white) delineate the regions of the 3D surface brightness maps shown on the right panels. Middle: surface brightness profiles in the F335M filter shown as a function of the distance from the IF. The FUV extinction decrease in the Bar (dotted lines) and the expected geometric dilution factor of the incident FUV field intensity from the O7-type star θ1 Ori C (dashed lines in the upper cut) are both normalized to the peak of the emission in the F335M filter for comparison. The vertical dotted-dashed lines indicate the average position of the IF, also indicated in yellow in the left panel. Right: 3D maps of the surface brightness profile in two regions defined in the left panel. For a, the grid is 24″ × 85.2″. It shows the sharp rise in brightness along the Bar. For b, the grid is 6.6″ ×13.3″. It shows bright fronts superimposed on the Bar emission. The orientations of the plots are optimized for the best viewing angle.
Current usage metrics show cumulative count of Article Views (full-text article views including HTML views, PDF and ePub downloads, according to the available data) and Abstracts Views on Vision4Press platform.
Data correspond to usage on the plateform after 2015. The current usage metrics is available 48-96 hours after online publication and is updated daily on week days.
Initial download of the metrics may take a while.


