Fig. 3

Download original image
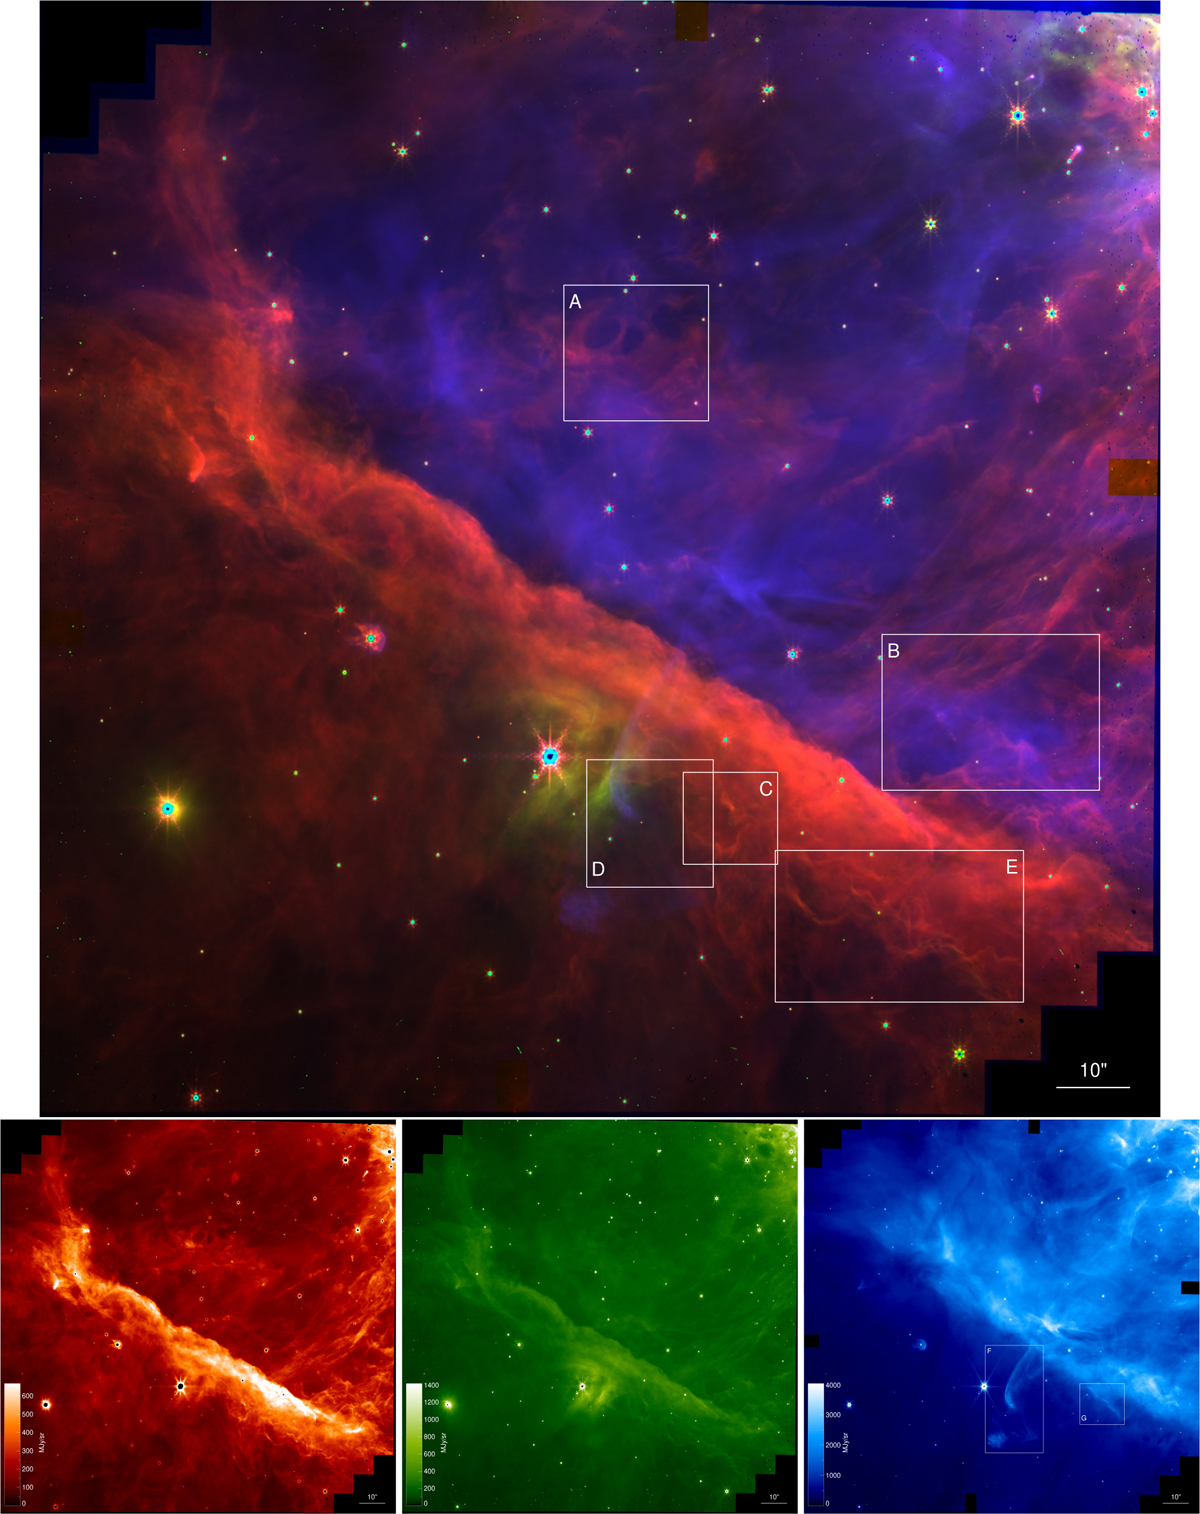
Inner region of the Orion Nebula as seen by the JWST’s NIRCam instrument with north up and east left. In the upper panel, three images in different filters were combined to produce an RGB composite image: F335M (red), F470N (green) and F187N (blue) that trace emission from hydrocarbons (AIBs), dust and molecular gas (H2 0–0 S(9) line), and ionized gas (Pa α line), respectively. The individual images used to make the RGB composite are shown in the lower panels. No continuum was subtracted. The size of the images is ~150″ × 150″. Most prominent is the Bar, a wall of dense gas and dust that runs from the top left to the bottom right in these images, and that contains the bright star θ2 Ori A 09.5 Vp which shines in the center of the Bar. The Bar and the surface of the Orion Molecular Cloud 1 (seen in the background in the front of the Bar) are illuminated by a group of hot, young massive stars forming the Trapezium Cluster, located just off the top right of the image. White boxes (labeled A, B, C, D, E, F and G) delineate regions of particular interest zoomed in and shown in Fig. 4.
Current usage metrics show cumulative count of Article Views (full-text article views including HTML views, PDF and ePub downloads, according to the available data) and Abstracts Views on Vision4Press platform.
Data correspond to usage on the plateform after 2015. The current usage metrics is available 48-96 hours after online publication and is updated daily on week days.
Initial download of the metrics may take a while.


