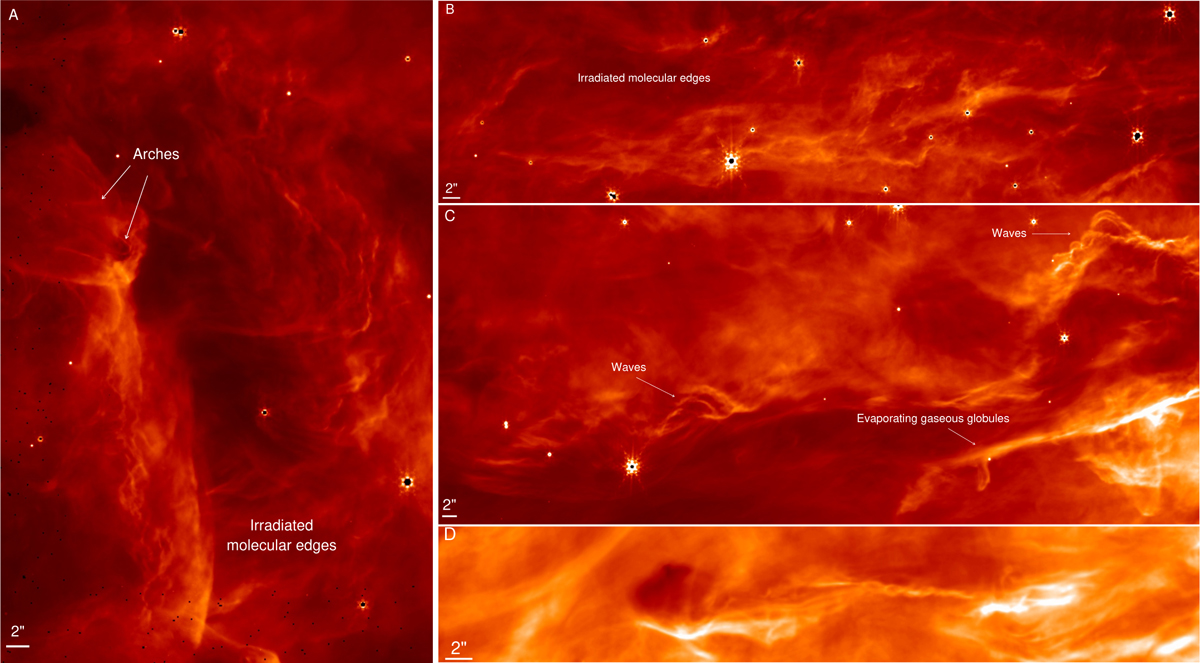
Fig. C.3

Download original image
Zoom into the F335M image areas shown in Figs. C.1 (for panels A, B) and C.2 (for panels B, C). A Irradiated molecular edges showing many patterns such as ridges and arches (which are most likely bow-shocks) detected in the southeast area of M42 North. B Irradiated molecular edges detected in the north area of M42 North. C Irradiated molecular edges showing many patterns such as ridges, waves and evaporating gaseous globule detected in the northwest area of the M43 South field. D Features driven by a large outflow detected in the south area of the M43 South field.
Current usage metrics show cumulative count of Article Views (full-text article views including HTML views, PDF and ePub downloads, according to the available data) and Abstracts Views on Vision4Press platform.
Data correspond to usage on the plateform after 2015. The current usage metrics is available 48-96 hours after online publication and is updated daily on week days.
Initial download of the metrics may take a while.


