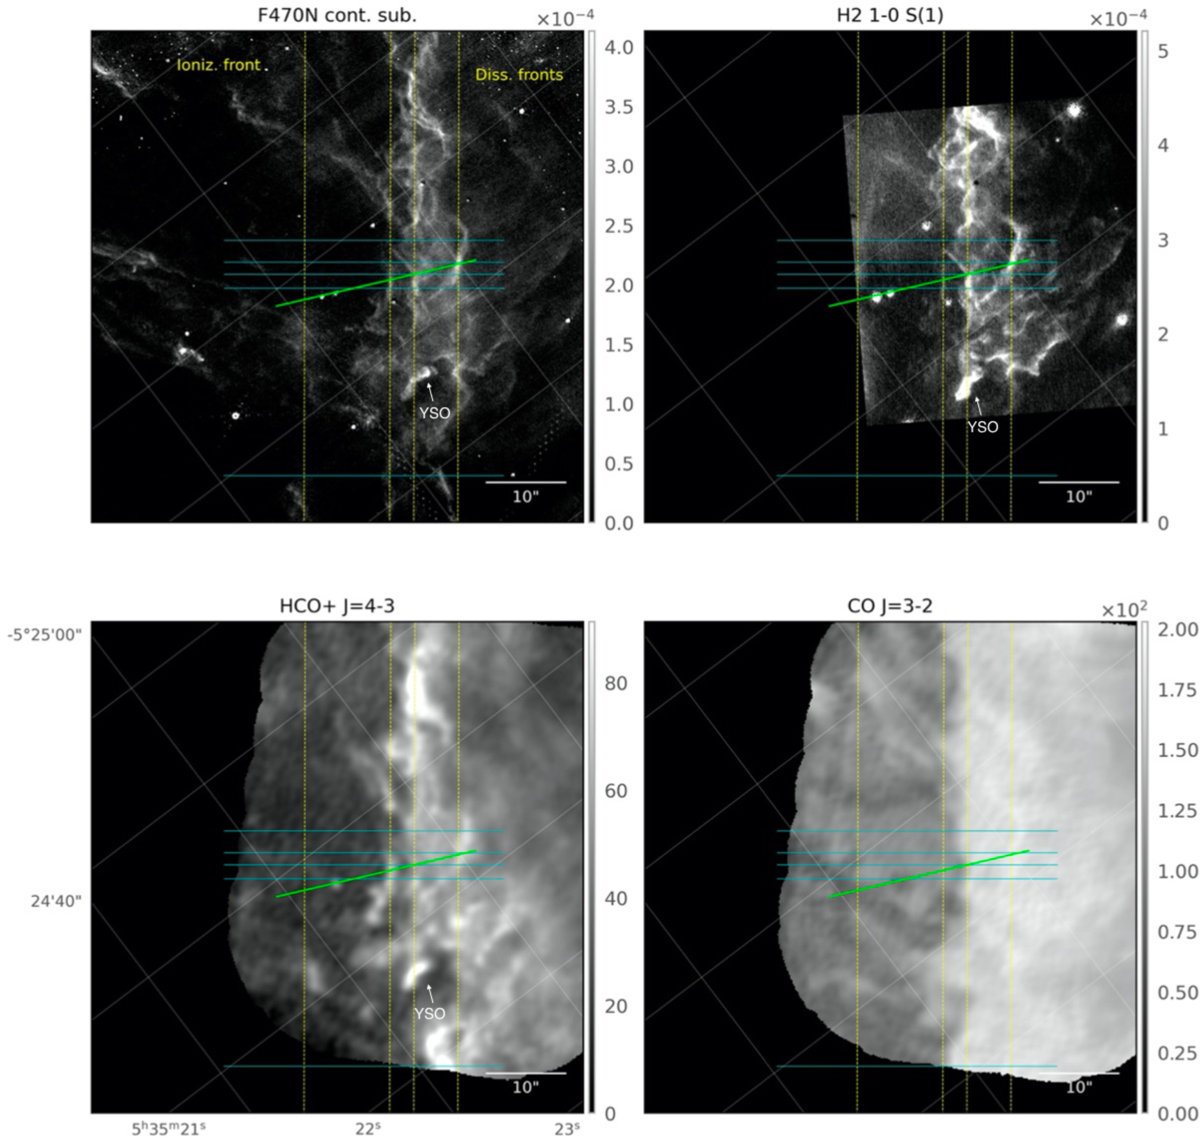
Fig. B.5

Download original image
NIRCam, Keck and ALMA maps of the southwestern part of Bar. The maps have been rotated so that the ionizing radiation strikes the Bar from the left. Upper left: Map in the F470N filter continuum subtracted (H2 0-0 S(9) line at 4.7 µm). Units are in erg s−1 cm−2 sr−1. Upper right: Keck/NIRC2 map of the H2 1-0 S(1) line at 2.12 µm with a resolution of 0.085″ (Habart et al. 2023). Our NIRCam observations show a very good agreement with Keck/NIRC2 observations in terms of line distribution and intensity. Lower left and right: ALMA observation at 1″ resolution of the HCO+ J = 4-–3 line integrated intensity (in K km s−1) and the CO J=3-2 line peak temperatures (Tpeak) (Goicoechea et al. 2016). There exists a remarkably similar spatial distribution between the H2 and HCO+ emission from ALMA.
Current usage metrics show cumulative count of Article Views (full-text article views including HTML views, PDF and ePub downloads, according to the available data) and Abstracts Views on Vision4Press platform.
Data correspond to usage on the plateform after 2015. The current usage metrics is available 48-96 hours after online publication and is updated daily on week days.
Initial download of the metrics may take a while.


