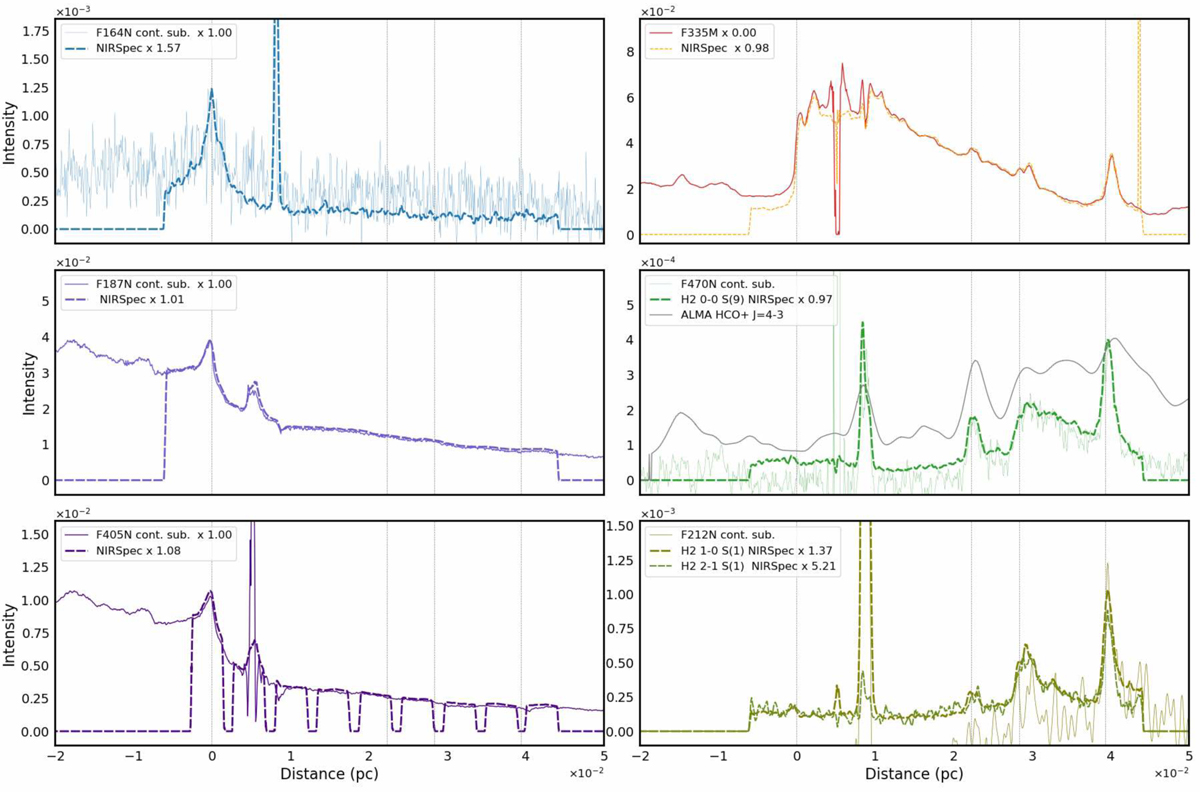
Fig. 11

Download original image
Intensity profiles shown as a function of the distance from IF along the NIRSpec cut (Fig. 10.) comparing NIRCam imaging data in selected filters (continuum substracted) and NIRSpec line intensities. Units are in erg cm−2 s−1 sr−1. The emission line intensities are continuum subtracted. The vertical dotted lines indicate the average position of the IF and the main DFs. In comparison to the cuts perpendicular to the Bar, it can be noted that the positions of the DFs are slightly shifted by approximately 0.0016 pc due to the inclination of the NIRSpec cut. The intensity profiles of the lines observed with NIRSpec have been scaled by the factors indicated in the legends. The intensities have not been corrected for dust extinction.
Current usage metrics show cumulative count of Article Views (full-text article views including HTML views, PDF and ePub downloads, according to the available data) and Abstracts Views on Vision4Press platform.
Data correspond to usage on the plateform after 2015. The current usage metrics is available 48-96 hours after online publication and is updated daily on week days.
Initial download of the metrics may take a while.


