Fig. 10

Download original image
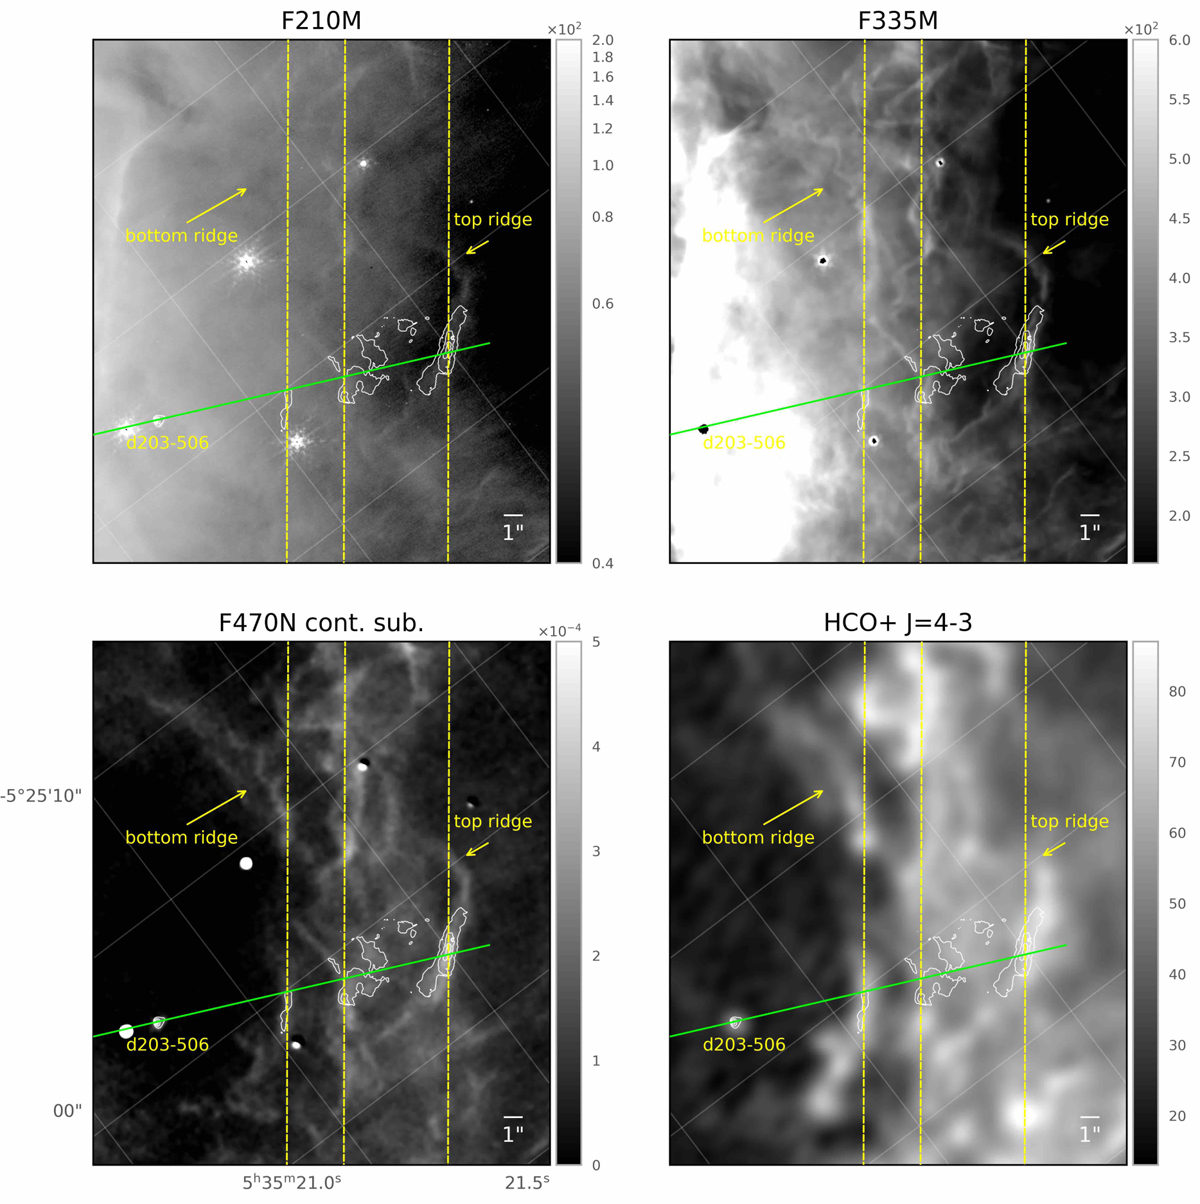
Zoom into the Bar covered in part by the NIRSpec observations. From upper left to bottom right: NIRCam maps in the F210M filter (tracing dust scattered light), F335M (emission from the 3.3 – 3.4µm aromatic and aliphatic CH stretching modes), continuum subtracted F470N (tracing H2 0–0 S(9)) and the ALMA HCO+ J = 4–3 map. Contours of the NIRSpec map in the 0-0 S(9) line with levels equal to 1.5, 2.3, 3.1, 3.9, 4.6 10−4 erg s−1 cm−2 sr−1 are shown in white. The vertical dotted yellow lines indicate the average position of the main DFs. The inclined line in green gives the position of the cut in the NIRSpec field shown in Fig. 11.
Current usage metrics show cumulative count of Article Views (full-text article views including HTML views, PDF and ePub downloads, according to the available data) and Abstracts Views on Vision4Press platform.
Data correspond to usage on the plateform after 2015. The current usage metrics is available 48-96 hours after online publication and is updated daily on week days.
Initial download of the metrics may take a while.


