Fig. 9
Download original image
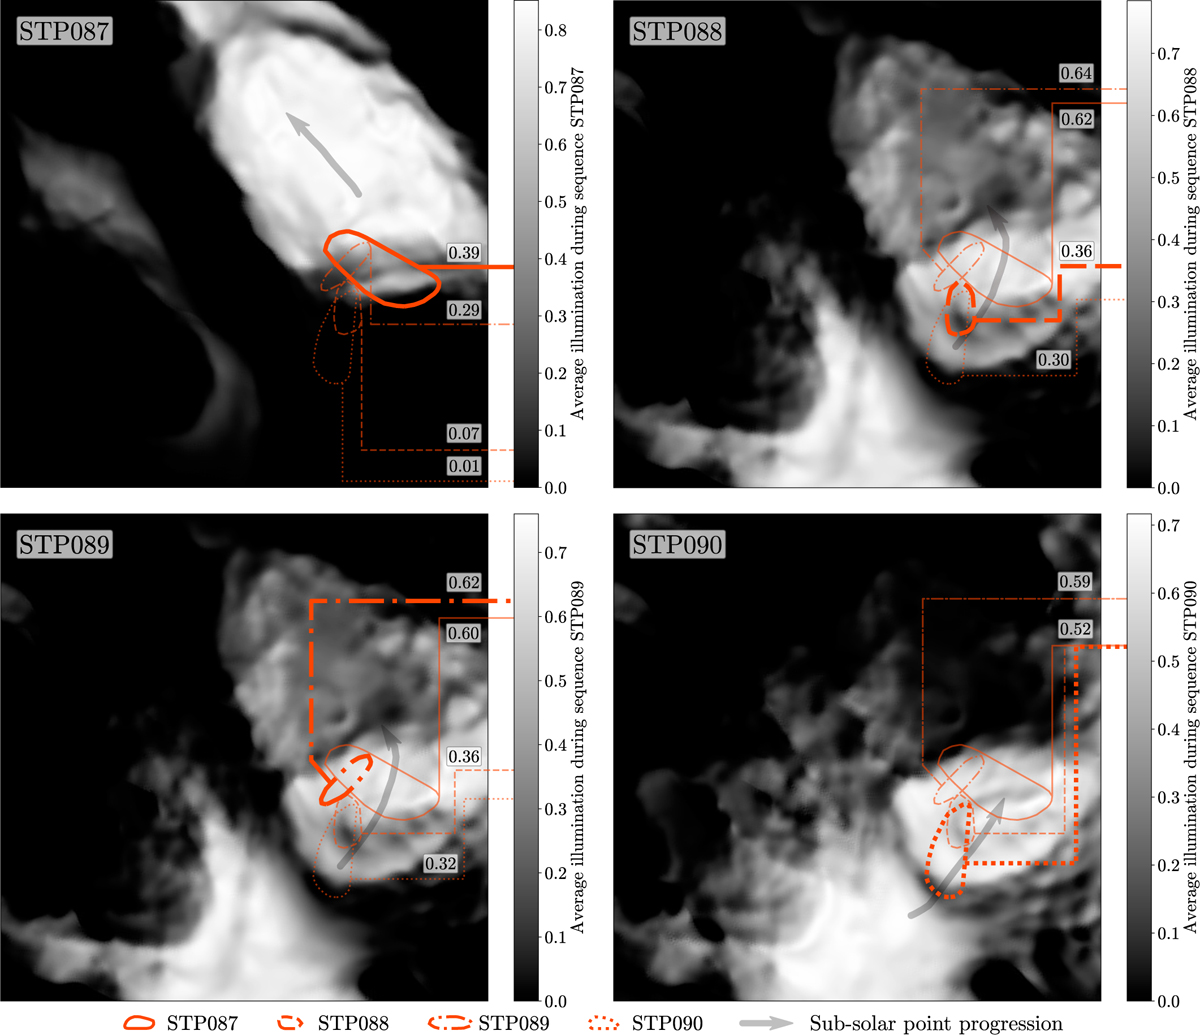
South-centered QuACK-maps of the average surface illumination received during the respective observational periods of the four sequences. The intensity units are the same as in Fig. 8. The mean values within the suspected source regions are indicated by the orange shapes and lines, with the areas that were selected during the respective sequences highlighted in bold. The values here are generally higher than in Fig. 8 because here the illumination was averaged over time periods when the areas were mostly in sunlight, while in Fig. 8 the illumination was averaged over a whole day-and-night cycle.
Current usage metrics show cumulative count of Article Views (full-text article views including HTML views, PDF and ePub downloads, according to the available data) and Abstracts Views on Vision4Press platform.
Data correspond to usage on the plateform after 2015. The current usage metrics is available 48-96 hours after online publication and is updated daily on week days.
Initial download of the metrics may take a while.