Fig. 8
Download original image
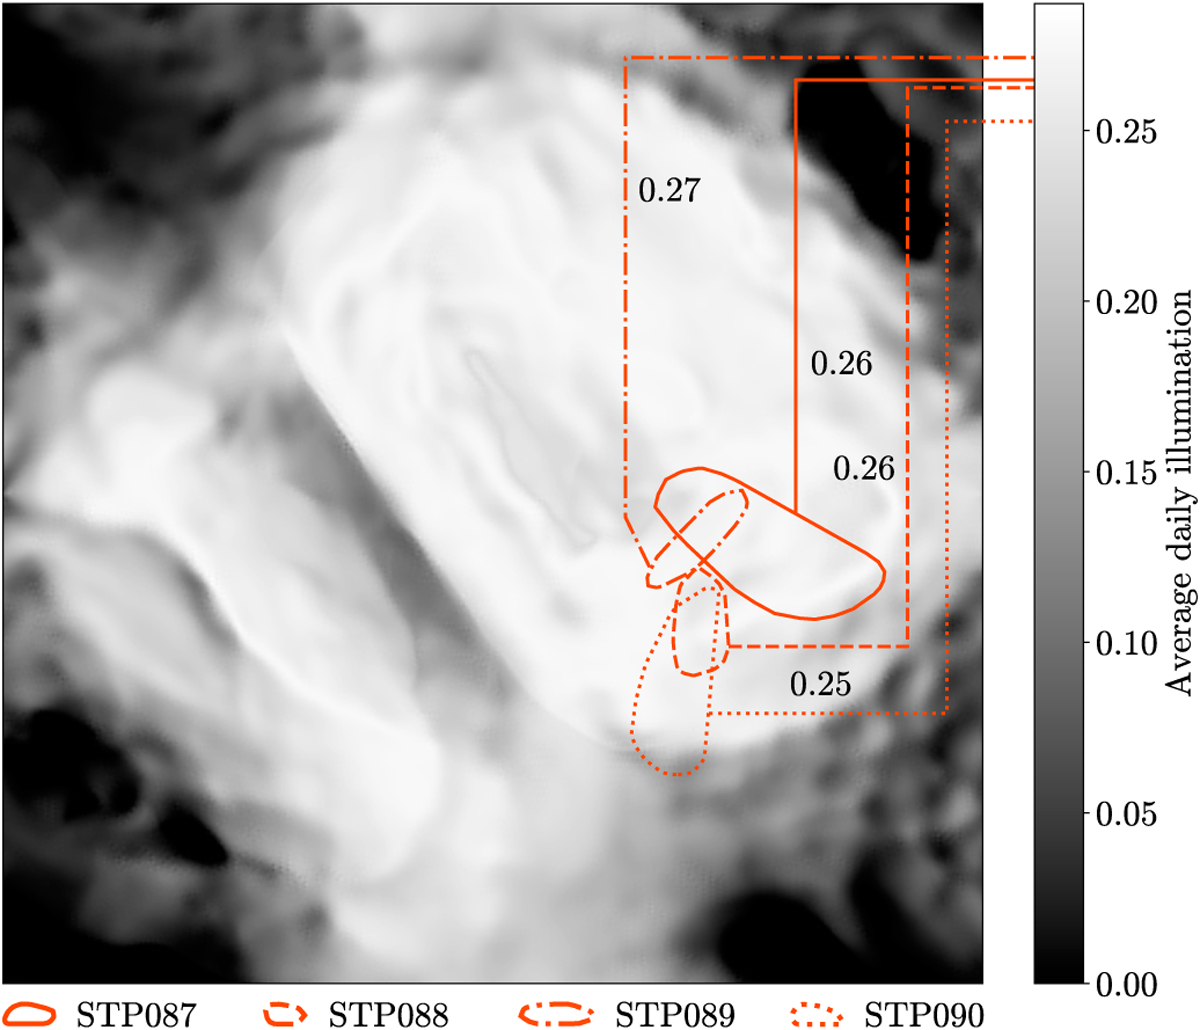
South-centered QuACK-map of the average nucleus illumination received over a whole comet day at the time of sequence STP088 (December 26, 2015). The intensity is measured in units of the average illumination at 1 AU from the Sun at the equator of the Earth over one Earth-day during equinox. The orange shapes and lines indicate the mean values within the suspected source regions.
Current usage metrics show cumulative count of Article Views (full-text article views including HTML views, PDF and ePub downloads, according to the available data) and Abstracts Views on Vision4Press platform.
Data correspond to usage on the plateform after 2015. The current usage metrics is available 48-96 hours after online publication and is updated daily on week days.
Initial download of the metrics may take a while.