Fig. 6
Download original image
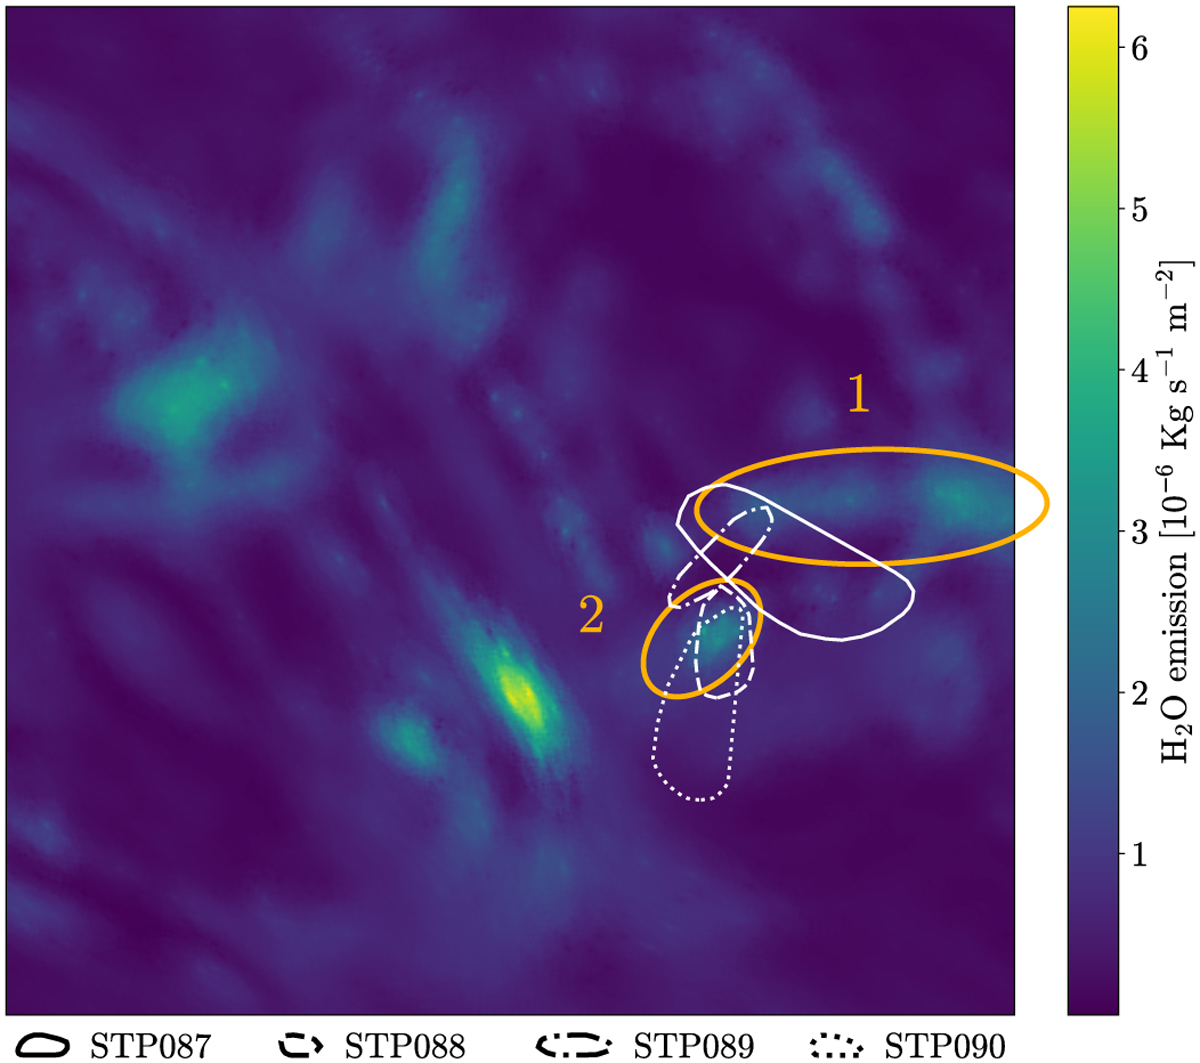
South-centered QuACK-map of the water emission rates predicted by Läuter et al. (2022), averaged over the period between December 13, 2015, and January 14, 2016 (data kindly provided by Matthias Läuter and Tobias Kramer). Also shown are the four suspected source regions and the approximate locations of areas 1 and 2 (orange ellipses, drawn in by hand) from Läuter et al. (2022).
Current usage metrics show cumulative count of Article Views (full-text article views including HTML views, PDF and ePub downloads, according to the available data) and Abstracts Views on Vision4Press platform.
Data correspond to usage on the plateform after 2015. The current usage metrics is available 48-96 hours after online publication and is updated daily on week days.
Initial download of the metrics may take a while.