Fig. D.10
Download original image
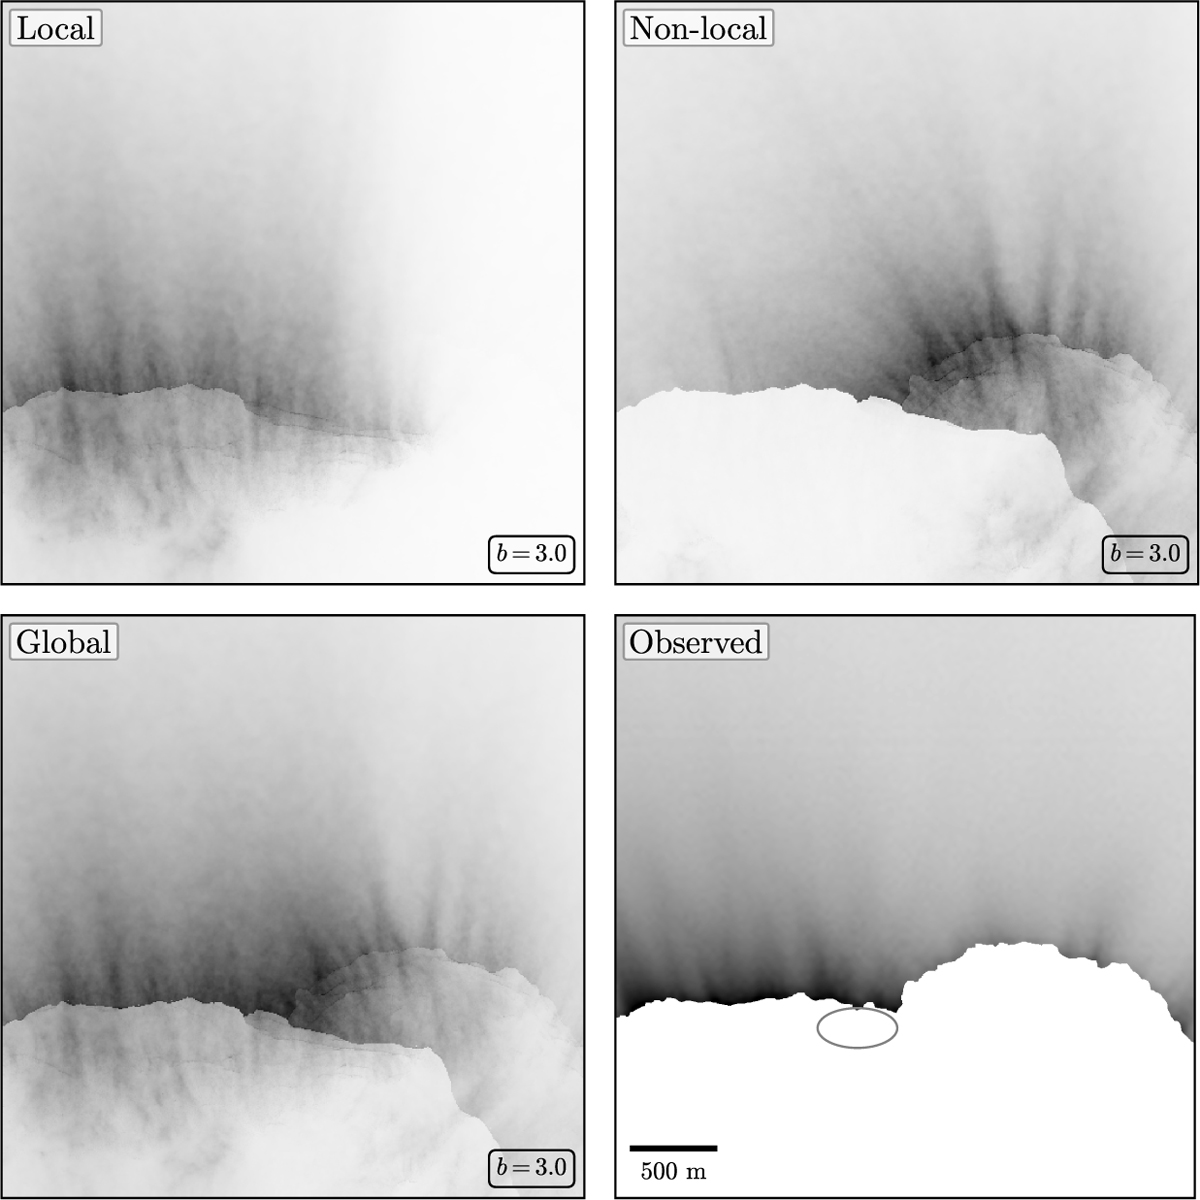
Comparison between coma simulations with different activity distributions given υinit = 0.5 m s−1, and the observed coma in the first image of sequence STP090. The image of the observed coma is the background signal that we subtracted during the preparation for the tracking procedure (see Sect. 2 and Pfeifer et al. 2022). The ellipse indicates the suspected source region. All images are brightness-inverted and had their contrasts improved individually for better reading. Because of this, the absolute intensity levels should not be compared across images, but only relative to other areas of the same image.
Current usage metrics show cumulative count of Article Views (full-text article views including HTML views, PDF and ePub downloads, according to the available data) and Abstracts Views on Vision4Press platform.
Data correspond to usage on the plateform after 2015. The current usage metrics is available 48-96 hours after online publication and is updated daily on week days.
Initial download of the metrics may take a while.