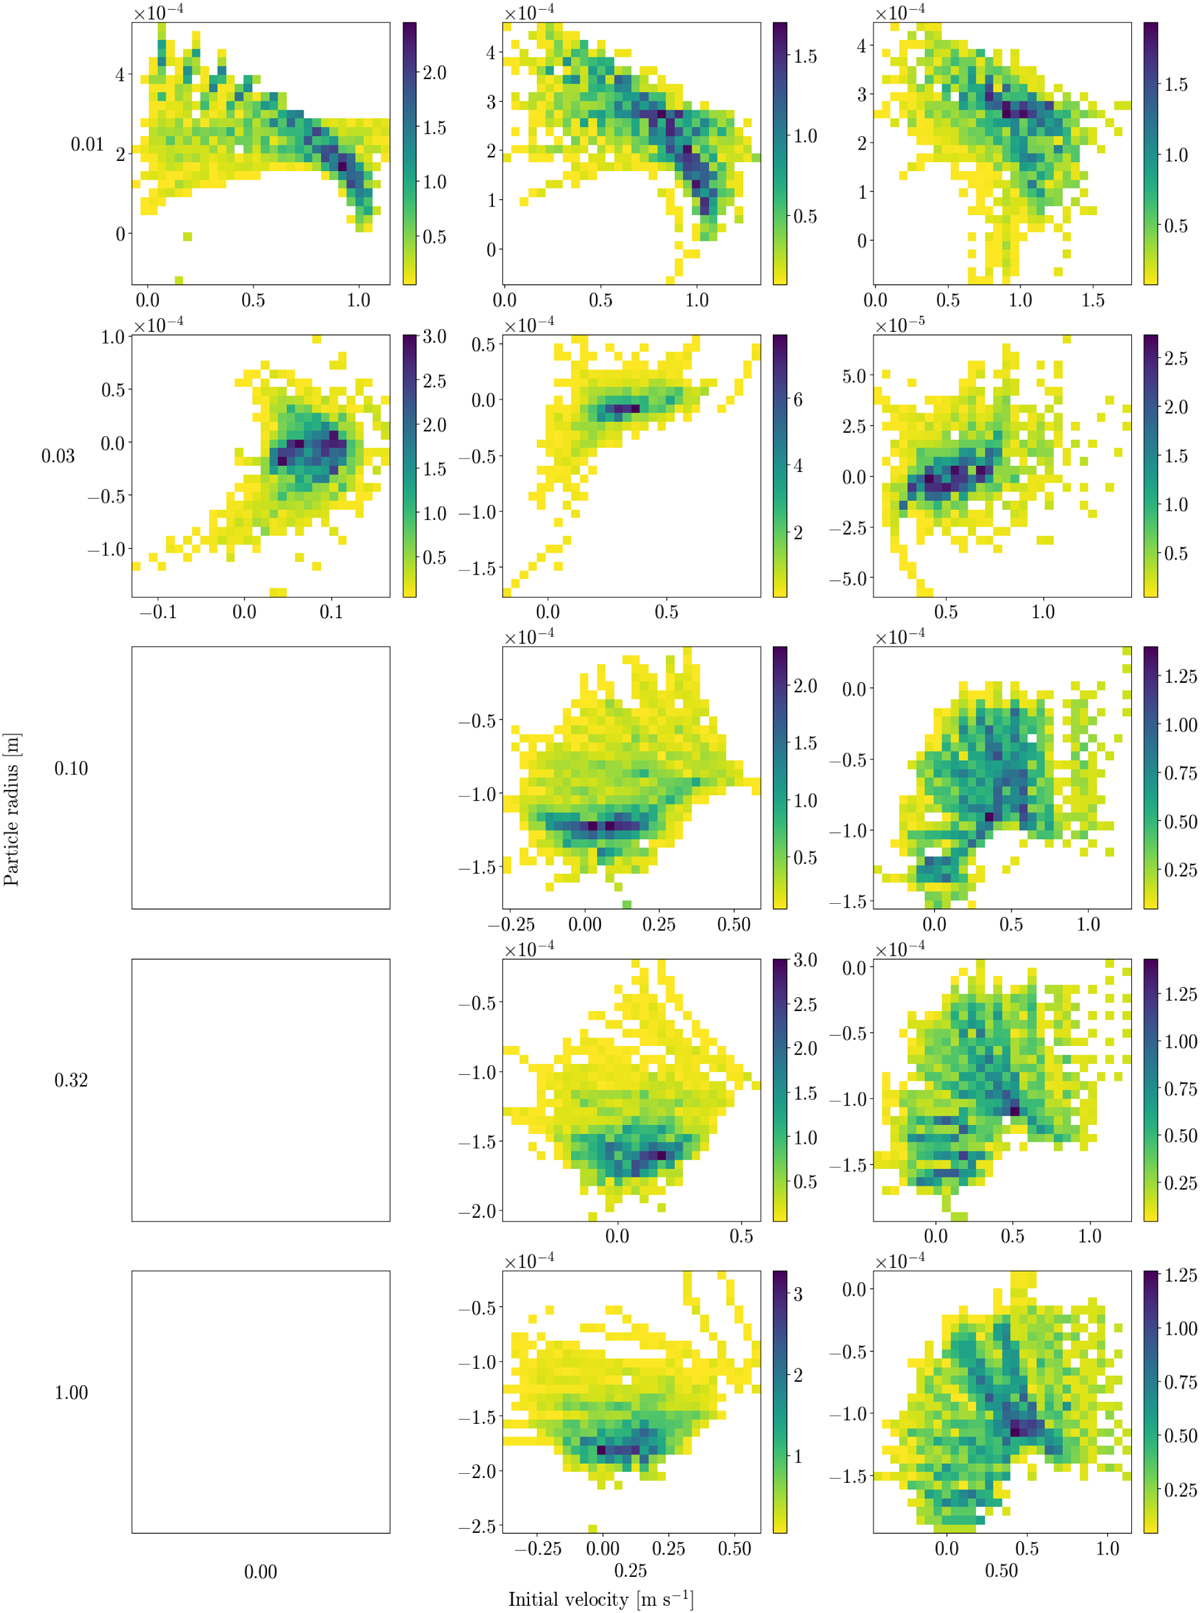
Fig. D.6
Download original image
Projected radial accelerations and velocities of the particles shown in Fig. D.5 (sequence STP090). As with the OSIRIS data, the values were determined by fitting third-order polynomials to the projected tracks. In each subplot, the x-axis shows the projected radial velocity in m s−1, the y-axis the projected radial acceleration in m s−2, and the color bar the number of measurements, which are again weighted by the number of measurements per respective track (residence time weighting). The three bottom left panels are blank because no particles were ejected in these instances.
Current usage metrics show cumulative count of Article Views (full-text article views including HTML views, PDF and ePub downloads, according to the available data) and Abstracts Views on Vision4Press platform.
Data correspond to usage on the plateform after 2015. The current usage metrics is available 48-96 hours after online publication and is updated daily on week days.
Initial download of the metrics may take a while.