Fig. 2
Download original image
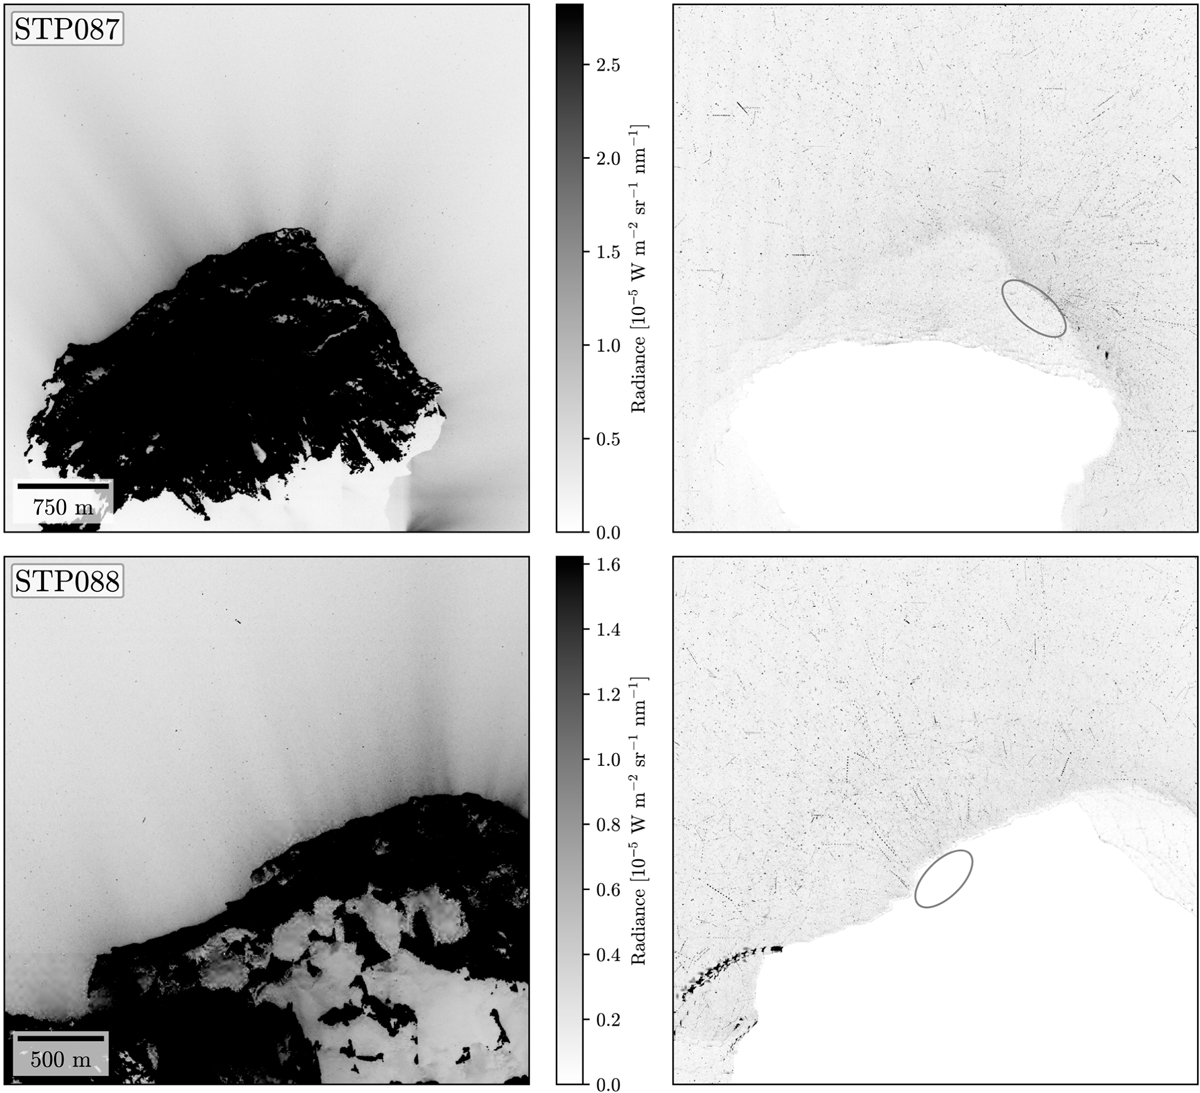
Sample images from sequences STP087 and STP088. First images of the respective sequences on the left, master images on the right. The ellipses in the master images mark the suspected source regions of the concentrated particle groups. All images are brightness-inverted and had their contrasts improved for better readability (for sequences STP089 and STP090 see Fig. A.1).
Current usage metrics show cumulative count of Article Views (full-text article views including HTML views, PDF and ePub downloads, according to the available data) and Abstracts Views on Vision4Press platform.
Data correspond to usage on the plateform after 2015. The current usage metrics is available 48-96 hours after online publication and is updated daily on week days.
Initial download of the metrics may take a while.