Fig. D.1
Download original image
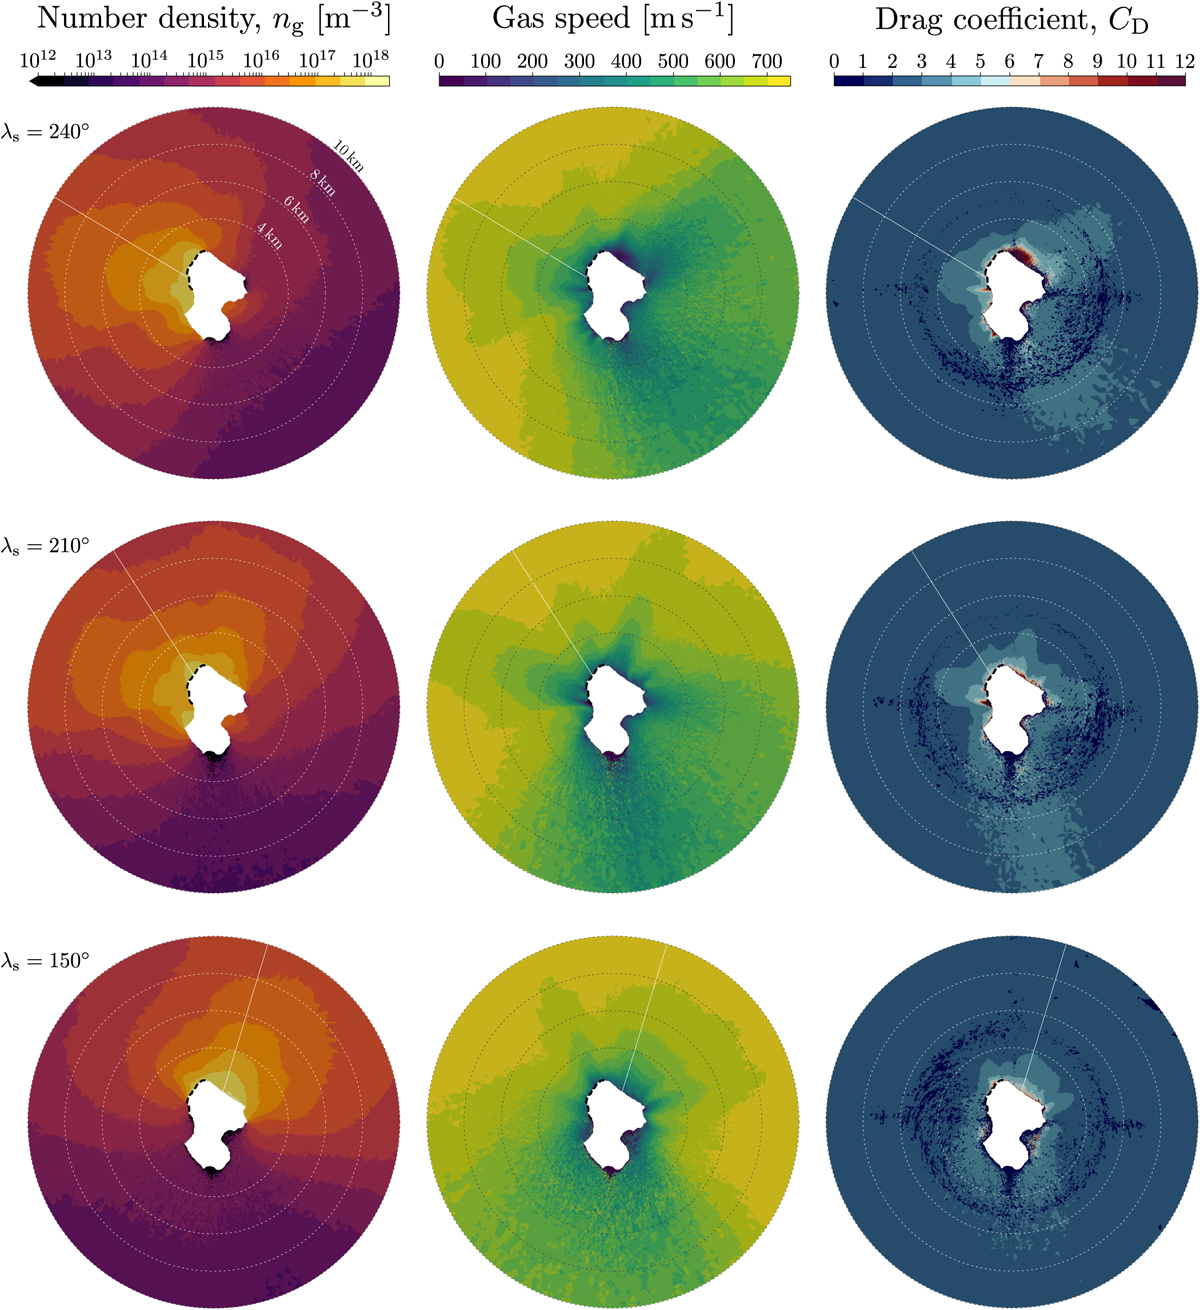
Properties of the three static gas solutions that we used for our dust coma models. The plots show model cross sections that slice through the suspected source regions, which are indicated by the bold dashed curves on the top left side of the nucleus. The solar directions are highlighted by the white lines. The drag coefficient plots show the results computed for global activity of 32 cm particles, which are representative for the whole relevant size range from 1 cm to 1 m. The circular artifacts in these plots, around 3 km from the nucleus, are a consequence of how the simulation domain was built (with a transition region between an inner sphere with very small cells and an outer region with much larger cells) and the low number of simulated particles.
Current usage metrics show cumulative count of Article Views (full-text article views including HTML views, PDF and ePub downloads, according to the available data) and Abstracts Views on Vision4Press platform.
Data correspond to usage on the plateform after 2015. The current usage metrics is available 48-96 hours after online publication and is updated daily on week days.
Initial download of the metrics may take a while.