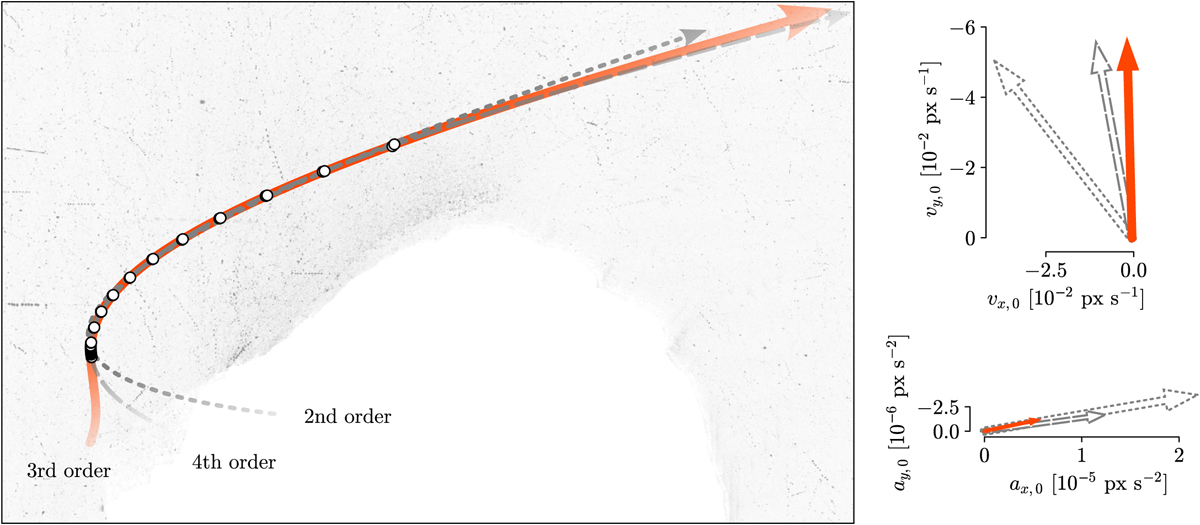
Fig. C.1
Download original image
Same particle track shown in Fig. 3 (white circles), but this time fitted with a second-, third-, and fourth-order polynomial, each extrapolated an hour back and over two and a half hours forward in time. The plots on the right show the respective derived vertical and horizontal particle velocities and accelerations at t = 0 s.
Current usage metrics show cumulative count of Article Views (full-text article views including HTML views, PDF and ePub downloads, according to the available data) and Abstracts Views on Vision4Press platform.
Data correspond to usage on the plateform after 2015. The current usage metrics is available 48-96 hours after online publication and is updated daily on week days.
Initial download of the metrics may take a while.