Fig. 13
Download original image
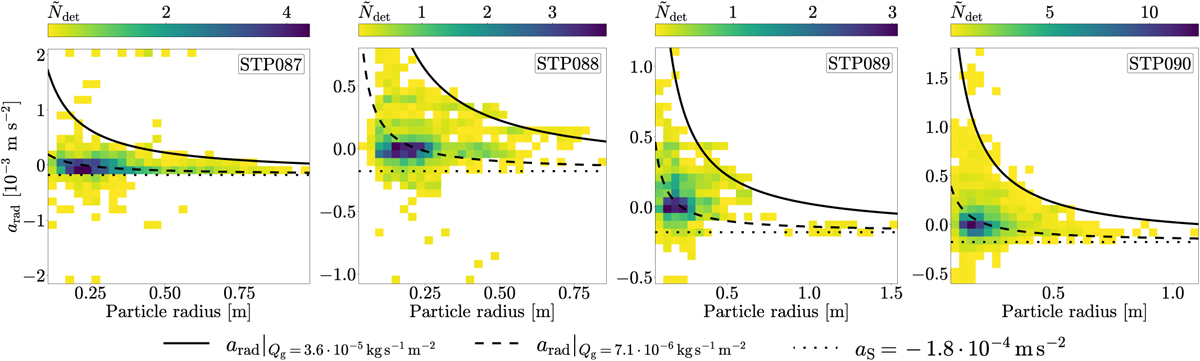
2D histograms of the projected radial particle accelerations, arad, as a function of particle radius (for the selected particles, see Fig. 4). The histogram values were determined analogously to the description in Fig. 12. Also shown are the predicted surface acceleration, as (dotted line, see also Fig. 11), and two models (dashed and solid curves) of the particle acceleration, as described by Eqs. (8) and (9). The parameters for both curves are based on our gas models (see Sect. 4.5), but for the solid curve, a local gas production rate was assumed that is about five times higher.
Current usage metrics show cumulative count of Article Views (full-text article views including HTML views, PDF and ePub downloads, according to the available data) and Abstracts Views on Vision4Press platform.
Data correspond to usage on the plateform after 2015. The current usage metrics is available 48-96 hours after online publication and is updated daily on week days.
Initial download of the metrics may take a while.