Fig. 12
Download original image
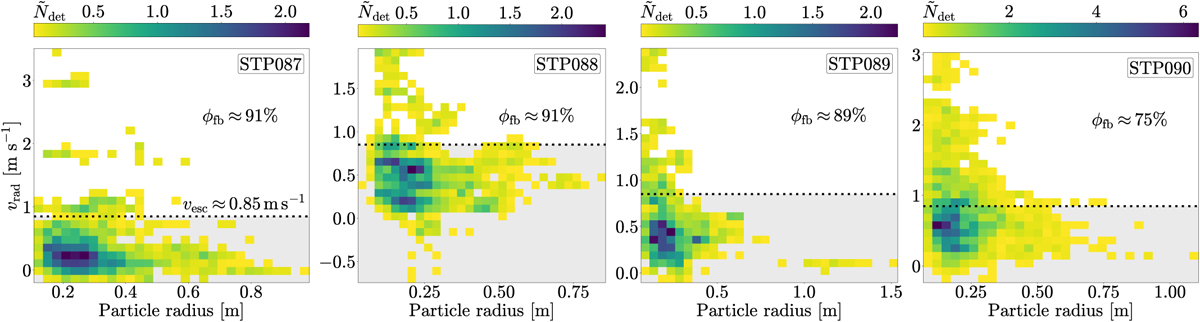
2D histograms of the projected radial particle velocities, υrad, as a function of particle radius (for the selected particles, see Fig. 4). Because the polynomial fits to the particle tracks also approximate the particle accelerations, instead of using values averaged over a track, the particle velocities and radii were determined for each detection of a track individually and the results were weighted by the number of detections of the respective track (residence time weighting). The histogram data thus represent the weighted number of detections, Ñdet. Also shown are the approximate escape speeds at the suspected source regions, υesc (dotted line), and the corresponding maximum fall-back fractions, ϕfb (gray area).
Current usage metrics show cumulative count of Article Views (full-text article views including HTML views, PDF and ePub downloads, according to the available data) and Abstracts Views on Vision4Press platform.
Data correspond to usage on the plateform after 2015. The current usage metrics is available 48-96 hours after online publication and is updated daily on week days.
Initial download of the metrics may take a while.