Open Access
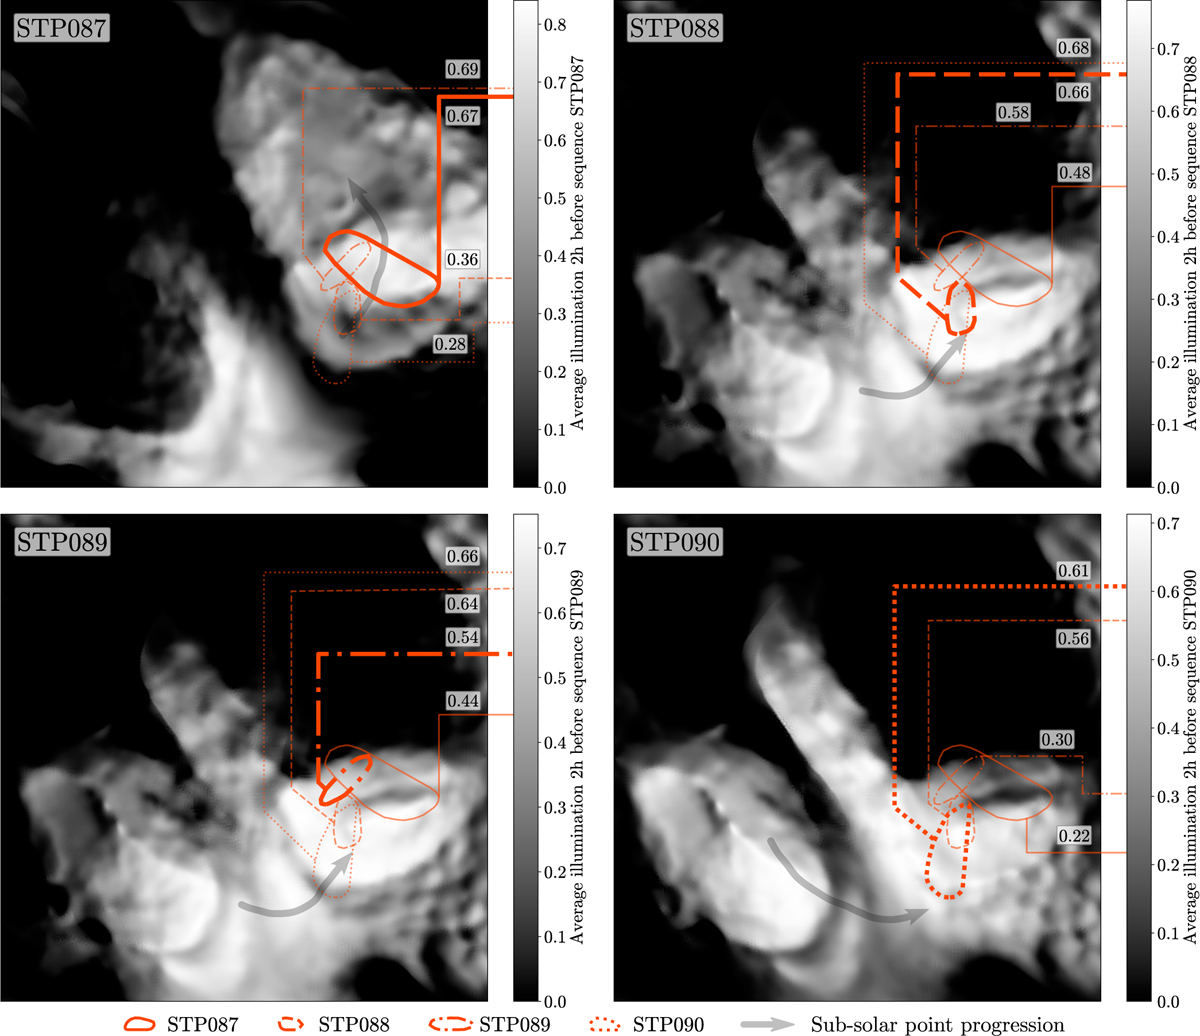
Fig. 10
Download original image
South-centered QuACK-maps of the average surface illumination received during the 2 h prior to the respective observational periods. The figure elements and intensity scale are analogous to those in Fig. 9.
Current usage metrics show cumulative count of Article Views (full-text article views including HTML views, PDF and ePub downloads, according to the available data) and Abstracts Views on Vision4Press platform.
Data correspond to usage on the plateform after 2015. The current usage metrics is available 48-96 hours after online publication and is updated daily on week days.
Initial download of the metrics may take a while.