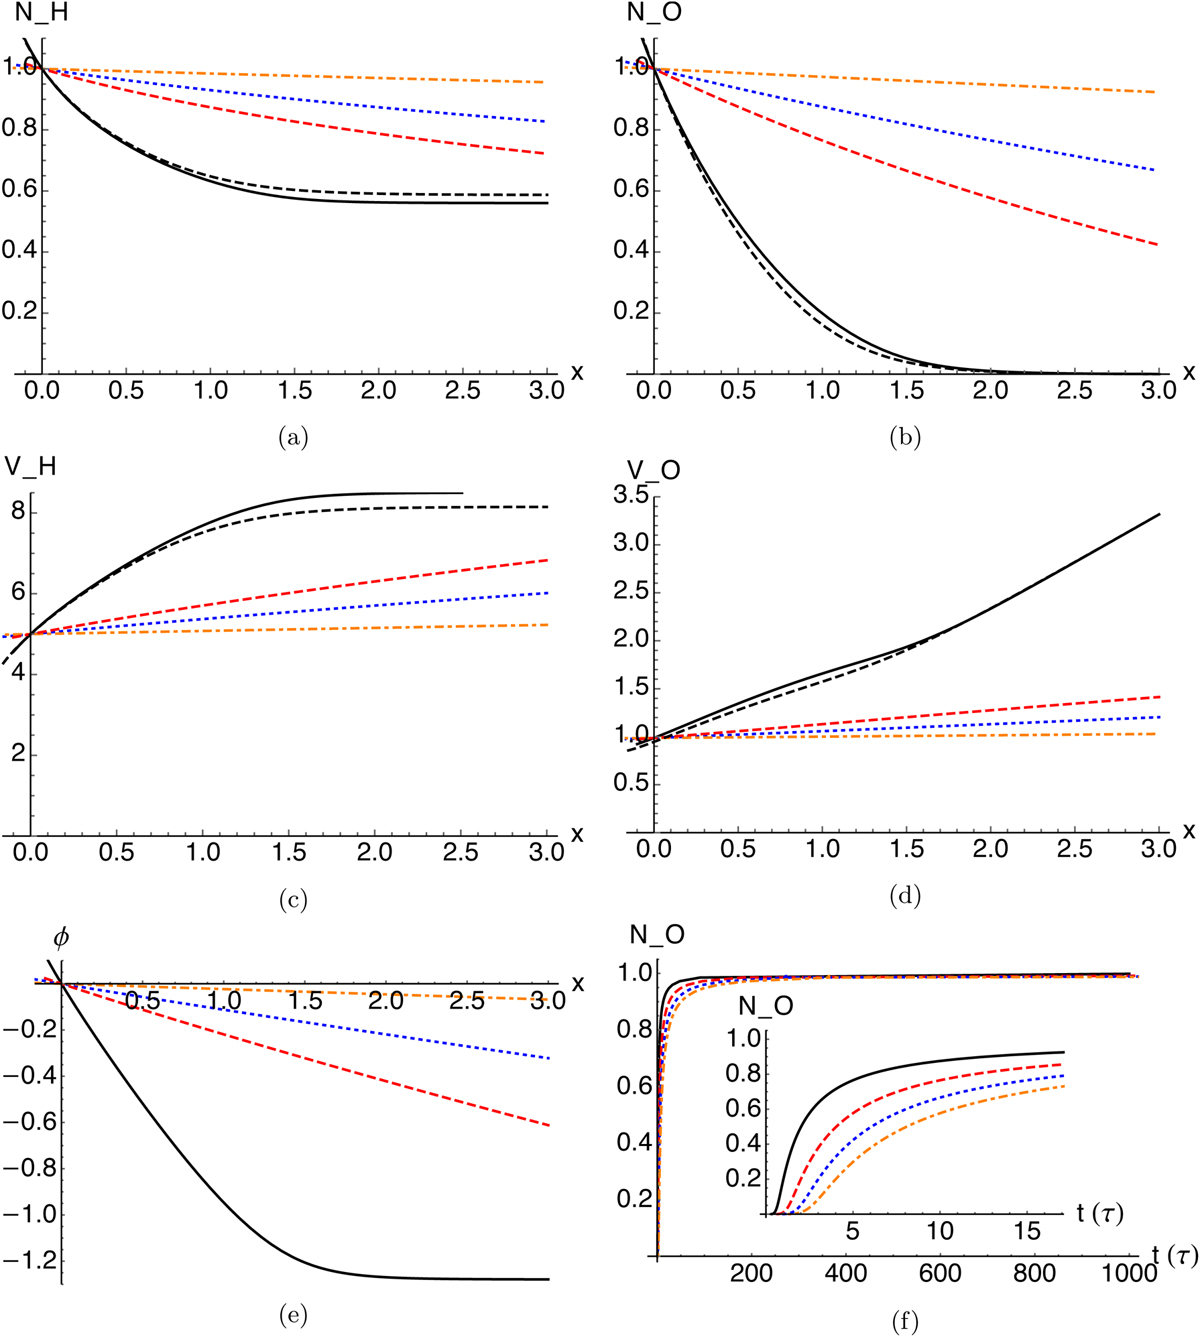
Fig. 4

Download original image
Spatial x (in units of plasma length scale λ = csτ) expansion profiles of (a, b) density, (c, d) velocity, and (e) electric potential for both oxygen (right) and hydrogen (left), respectively, after different time intervals t, including 1 (black), 5 (red-dashed), 10 (blue-dotted), 50 (orange dash-dotted). (f) Time profile (in units of the plasma timescale τ = 1 s) of the oxygen density at different values of distance x: 1 (black), 2 (red-dashed), 3 (blue-dotted), and 4 (orange dash-dotted). Here, the solar wind initial velocity is Vsp[0] = Vse[0] = 10; the ratio of the temperatures is σsp = σse = 1; and for the initial solar wind number density we took the ratio γ = 0.5. The black-dashed lines in (a) to (d) refer to the result at t = 1 for a solar wind initial velocity of Vsp[0] = Vse[0] = 30.
Current usage metrics show cumulative count of Article Views (full-text article views including HTML views, PDF and ePub downloads, according to the available data) and Abstracts Views on Vision4Press platform.
Data correspond to usage on the plateform after 2015. The current usage metrics is available 48-96 hours after online publication and is updated daily on week days.
Initial download of the metrics may take a while.


