Fig. 8
Download original image
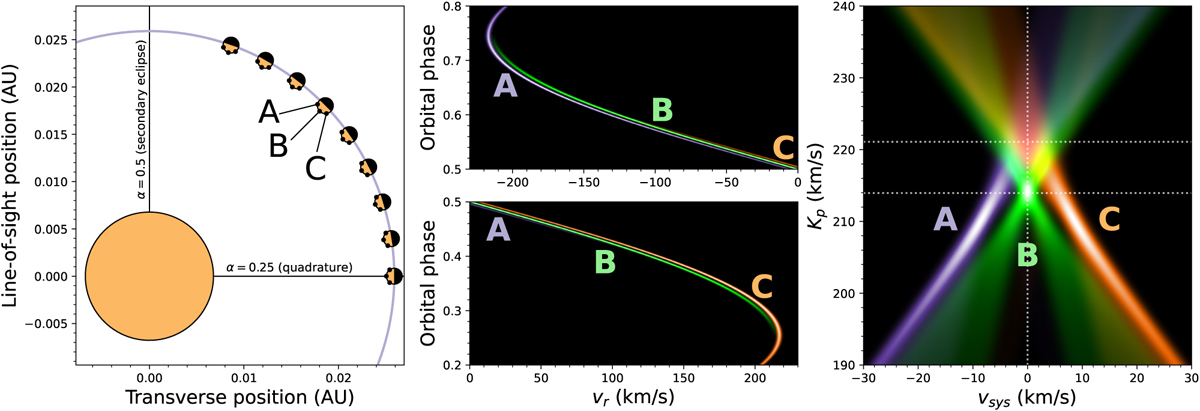
Model of the velocity traces of three points on the dayside near the morning limb (A), substellar point (B), and the evening limb (C). Left panel: schematic of the WASP-121 b system to scale, with orbital phases between quadrature and secondary eclipse. The line of sight is along the vertical axis. Middle panels: model of the cross-correlation traces, assuming that line emission originates from each of the three spots in equal strength, with a line width corresponding to the instrumental resolving power. Planetary rotation causes small differences in the location of each trace. Right panel: co-added velocity–velocity diagram showing the signal due to each of the three points. White dotted lines indicate the true orbital velocity and the velocity at which the substellar point peaks.
Current usage metrics show cumulative count of Article Views (full-text article views including HTML views, PDF and ePub downloads, according to the available data) and Abstracts Views on Vision4Press platform.
Data correspond to usage on the plateform after 2015. The current usage metrics is available 48-96 hours after online publication and is updated daily on week days.
Initial download of the metrics may take a while.