Fig. 5
Download original image
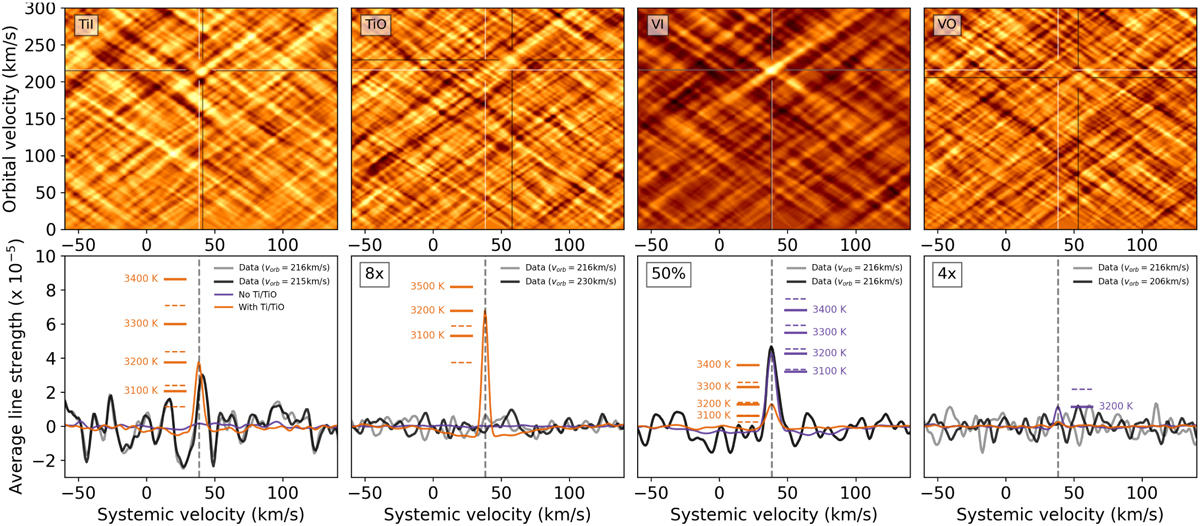
Same as Fig. 4, but for Ti, TiO, V, and VO. Ti and TiO are not detected but are predicted by models that contain Ti and TiO opacity. VO is not detected, nor does the model indicate that the data are sensitive regardless of temperature, unless the metallicity is significantly increased. The horizontal bars of VO for different temperatures overlap, so only 3200 K is shown. In-set scaling factors denote the factor by which the y-axis was zoomed into to allow the signals to be plotted on the same scale. 50% means that the vertical axis labels should be read as being a factor of 2 bigger, and vice versa.
Current usage metrics show cumulative count of Article Views (full-text article views including HTML views, PDF and ePub downloads, according to the available data) and Abstracts Views on Vision4Press platform.
Data correspond to usage on the plateform after 2015. The current usage metrics is available 48-96 hours after online publication and is updated daily on week days.
Initial download of the metrics may take a while.