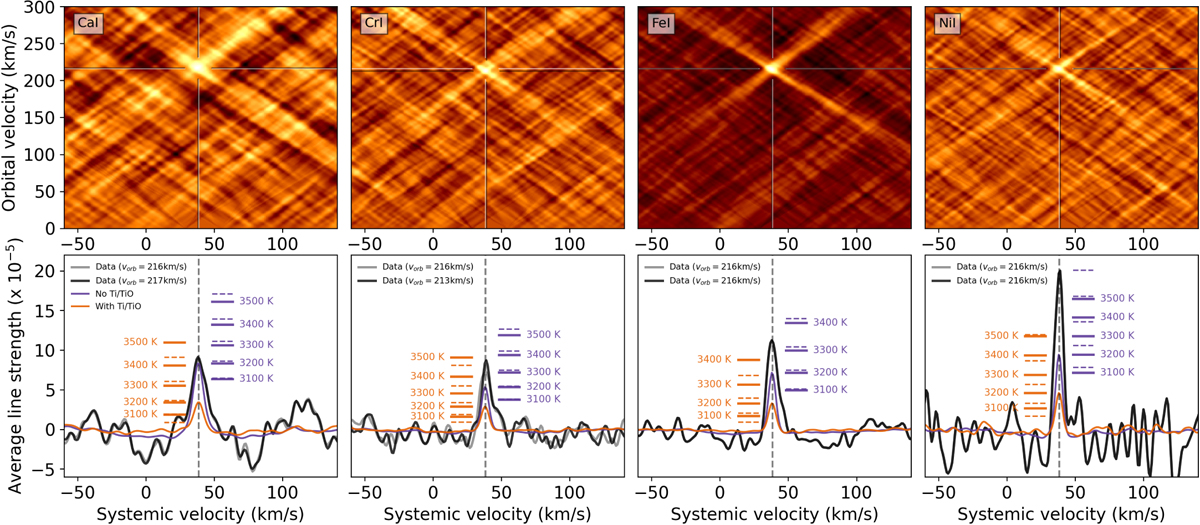
Fig. 4
Download original image
Detections of Ca, Cr, Fe, and Ni in the emission spectrum of WASP-121 b in velocity-velocity space (upper panels) and the extracted one-dimensional CCFs (bottom panels). The one-dimensional CCFs were extracted at an orbital velocity of 216.0 km s−1 (gray line), i.e., slightly below the expected velocity of 221.1 km s−1 as derived from the known orbital parameters, or at the orbital velocity at which the peak occurs (black line) to illustrate the effect of the choice of orbital velocity at which to extract. The vertical axis indicates the weighted emission line strength (not the relative signal-to-noise). This quantity derives its physical meaning from comparison with injected models. Colored dashed lines indicate the signals caused by injected models with and without Ti and TiO at a metallicity of 5 times solar (equal to 0.7 dex, the metallicity found and used by Mikal-Evans et al. 2022), with an inverted T-P profile that is isothermal at 3200 K at pressures of log(P) = −2.8 and below. At altitudes above this pressure, the HST data published by Mikal-Evans et al. (2022) do not constrain the T–P profile. Horizontal bars indicate the signal strength of models with variations in this peak temperature, and thus the strength of the thermal inversion. The solid bars indicate models with a metallicity of 5 times solar, and the dashed bars indicate 10 times solar.
Current usage metrics show cumulative count of Article Views (full-text article views including HTML views, PDF and ePub downloads, according to the available data) and Abstracts Views on Vision4Press platform.
Data correspond to usage on the plateform after 2015. The current usage metrics is available 48-96 hours after online publication and is updated daily on week days.
Initial download of the metrics may take a while.