Fig. A.3
Download original image
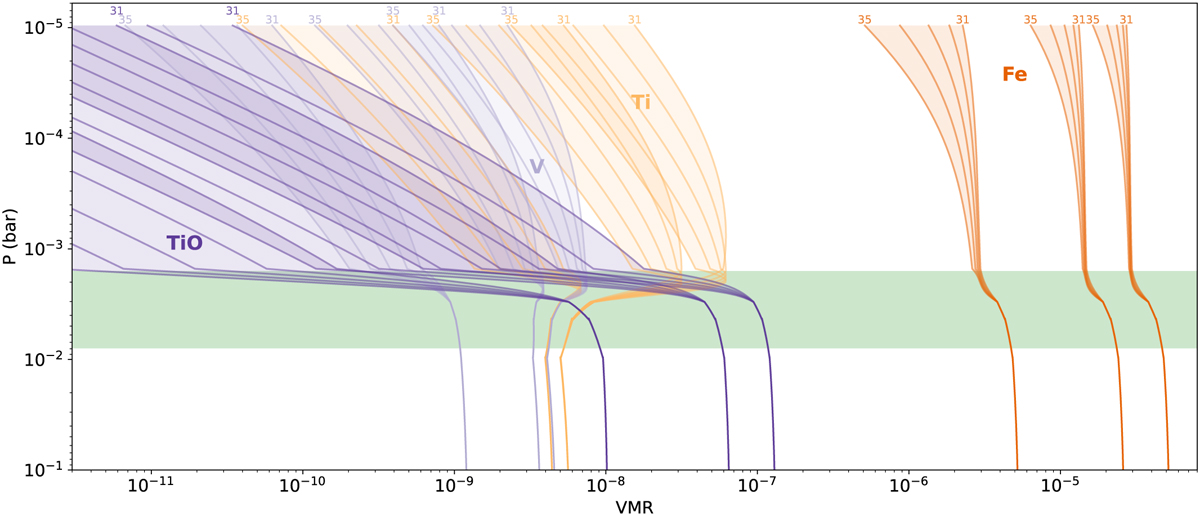
Abundance profiles of Fe, Ti, V, and TiO for the different T-P profiles described in Section 3.3. Each species is plotted for three different metallicity values (increasing from left to right as 1 time, 5 times, and 10 times solar) and for five isothermal peak temperature values (3100 K to 3500 K), indicated by the double-digit labels at the top. The shaded horizontal region indicates the range of pressures over which the HST data analyzed by Mikal-Evans et al. (2022) are sensitive, and where the temperature inversion takes place.
Current usage metrics show cumulative count of Article Views (full-text article views including HTML views, PDF and ePub downloads, according to the available data) and Abstracts Views on Vision4Press platform.
Data correspond to usage on the plateform after 2015. The current usage metrics is available 48-96 hours after online publication and is updated daily on week days.
Initial download of the metrics may take a while.