Fig. A.1
Download original image
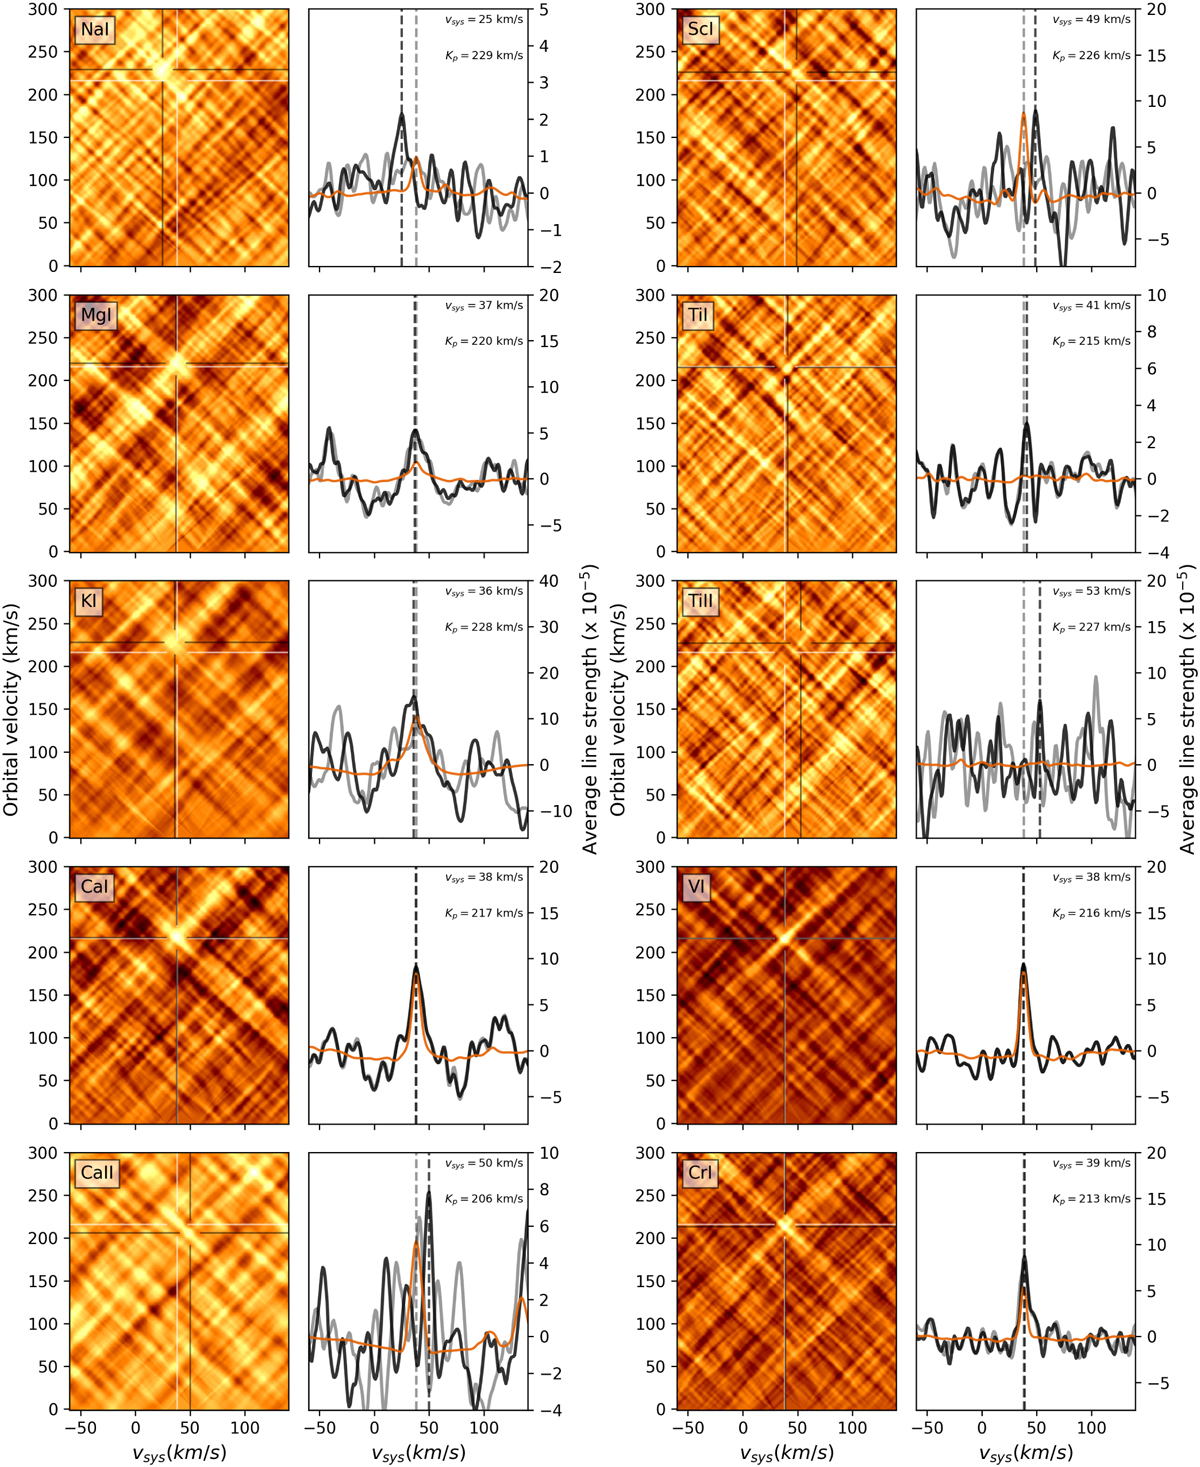
Collection of the CCFs of all species searched for in this study, similar to Fig. 4. The CCFs are organized into two pairs of columns, with the Kp-υsys diagram on the left, and the one-dimensional CCF extracted at an orbital velocity of 216.0 km/s (gray lines) or at the orbital velocity at which the CCF peaks (black lines), as in Fig. 4. The values in the top-left corner are the peak position. The orange lines indicate the expected signal of a model spectrum without Ti and TiO and a temperature inversion from 2500 K to 3200 K.
Current usage metrics show cumulative count of Article Views (full-text article views including HTML views, PDF and ePub downloads, according to the available data) and Abstracts Views on Vision4Press platform.
Data correspond to usage on the plateform after 2015. The current usage metrics is available 48-96 hours after online publication and is updated daily on week days.
Initial download of the metrics may take a while.