Fig. 1
Download original image
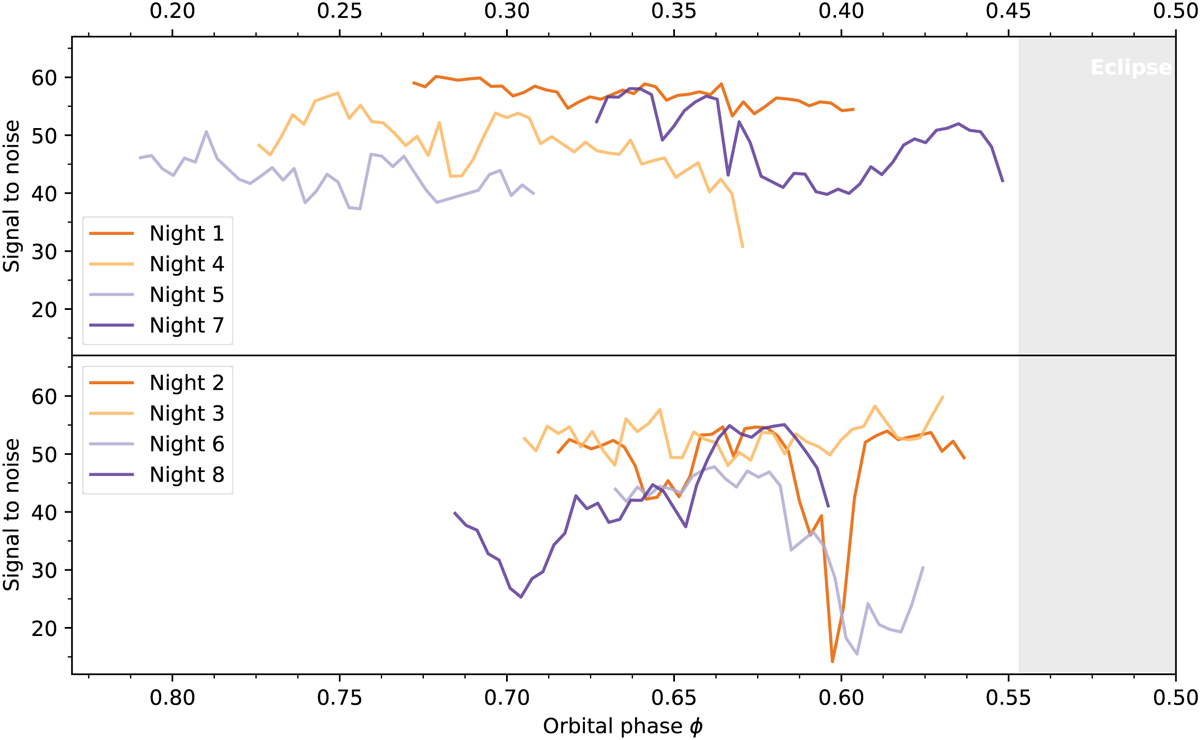
Signal-to-noise ratio and orbital phase of each of the eight time series. The top panel shows pre-eclipse data and the bottom panel post-eclipse data, with the phase axis reversed such that the secondary eclipse is on the right (highlighted in gray). The signal-to-noise ratio is as measured by the DRS in order 102, covering wavelengths around 550 nm. The time series are numbered chronologically, corresponding to Table 1.
Current usage metrics show cumulative count of Article Views (full-text article views including HTML views, PDF and ePub downloads, according to the available data) and Abstracts Views on Vision4Press platform.
Data correspond to usage on the plateform after 2015. The current usage metrics is available 48-96 hours after online publication and is updated daily on week days.
Initial download of the metrics may take a while.