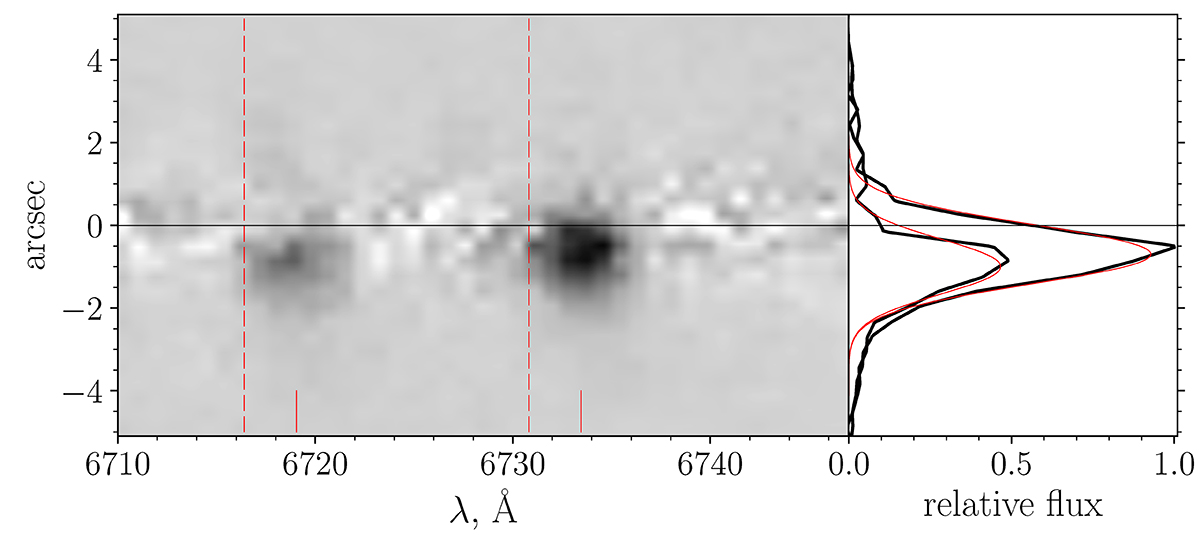
Fig. 2.
Download original image
TDS spectrum of the micro-jet. Left panel: long-slit TDS spectrum of BP Tau near [S II] lines observed at PA = 62°. The image is centered on the star in spatial and wavelength coordinates. The spatial profile of the stellar spectrum has been removed. Emission knots are shifted to the southwest from the star. The rest wavelengths of the [S II] lines are shown with dashed lines. The measured velocity of +118 km s−1 is marked with solid red lines. Right panel: relative flux distribution in the [S II] 6716 and 6731 Å lines along the slit and the corresponding fits with Gaussian profiles.
Current usage metrics show cumulative count of Article Views (full-text article views including HTML views, PDF and ePub downloads, according to the available data) and Abstracts Views on Vision4Press platform.
Data correspond to usage on the plateform after 2015. The current usage metrics is available 48-96 hours after online publication and is updated daily on week days.
Initial download of the metrics may take a while.