Open Access
Fig. 3.
Download original image
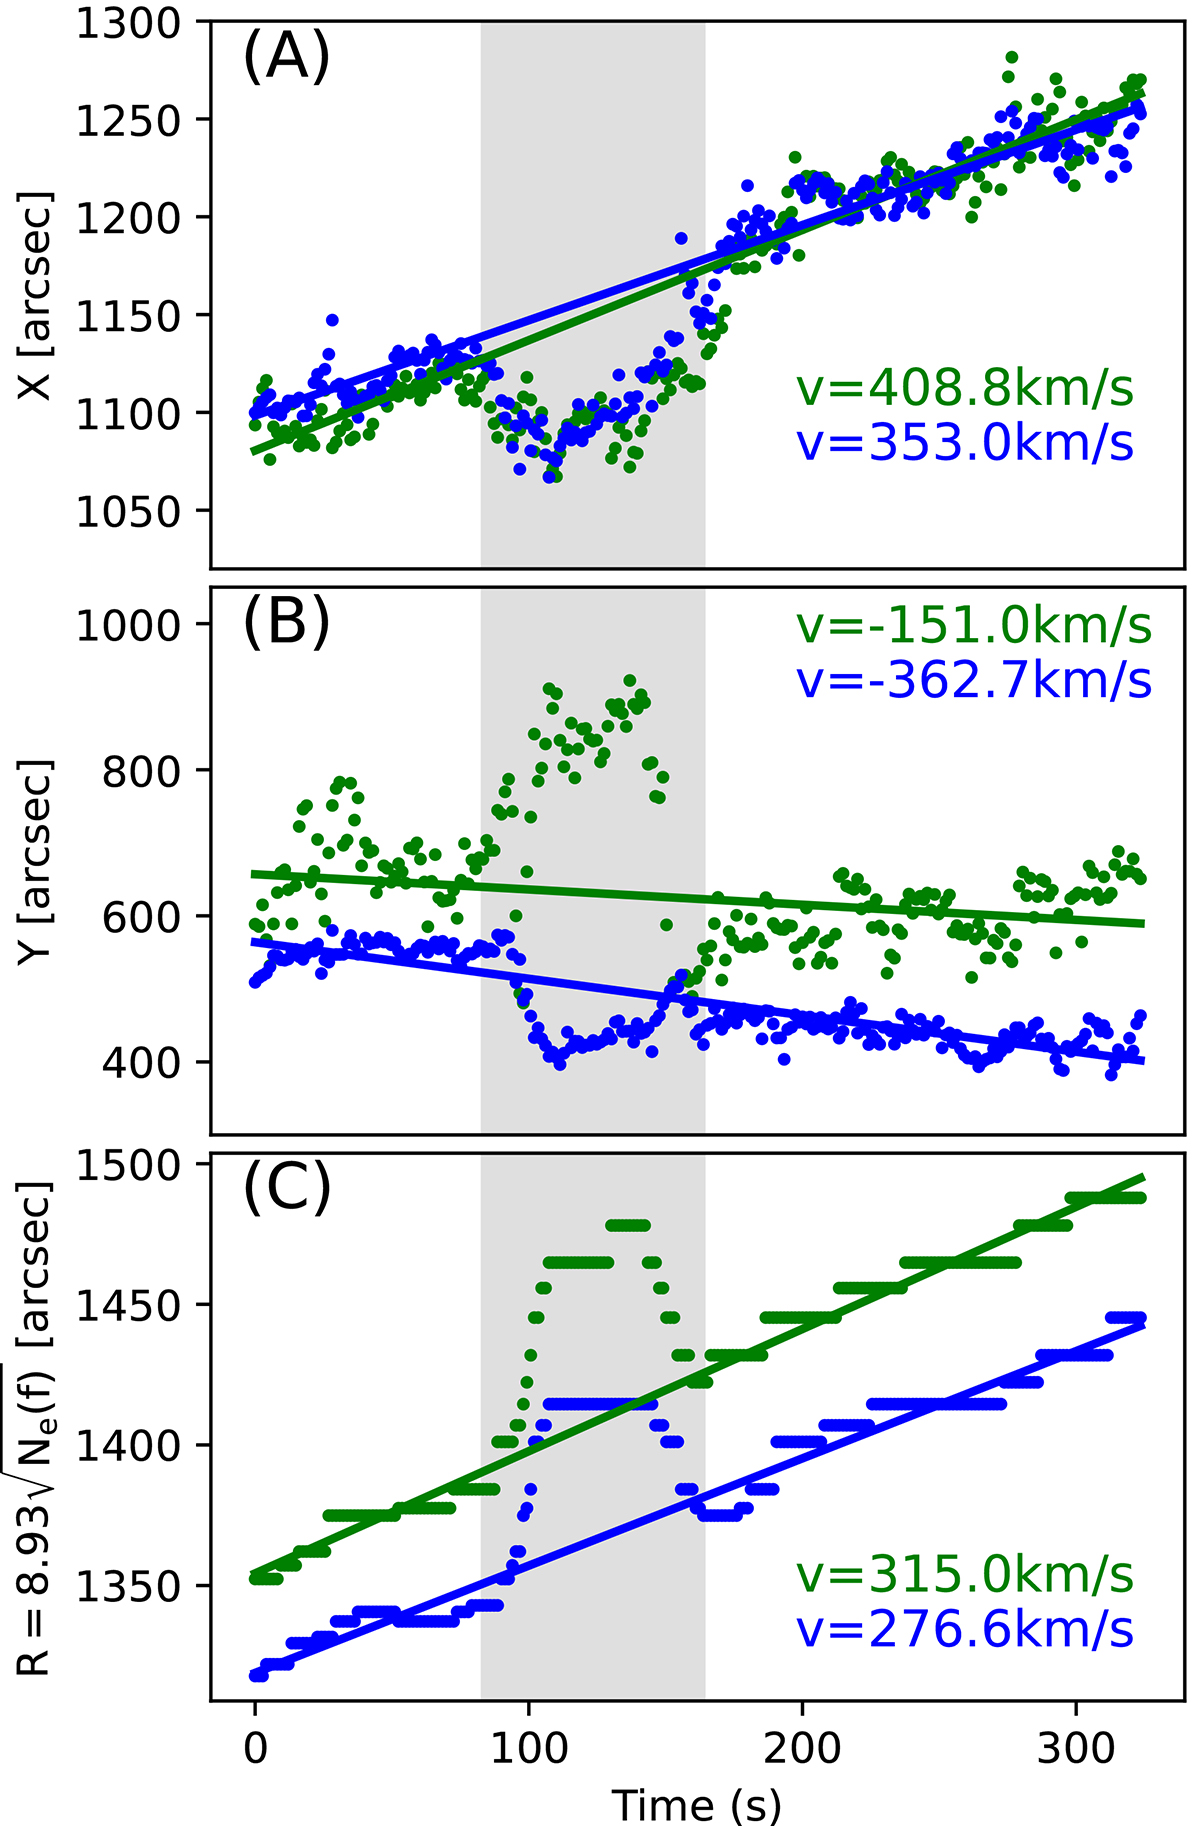
Source location variations in the X and Y directions are shown in panels A and B. The heliocentric distance of the source derived from the frequency of the imaging is shown in panel C. The solid lines are the fitted result of the points in phase 1 and phase 3 (i.e., the points outside of the gray area).
Current usage metrics show cumulative count of Article Views (full-text article views including HTML views, PDF and ePub downloads, according to the available data) and Abstracts Views on Vision4Press platform.
Data correspond to usage on the plateform after 2015. The current usage metrics is available 48-96 hours after online publication and is updated daily on week days.
Initial download of the metrics may take a while.