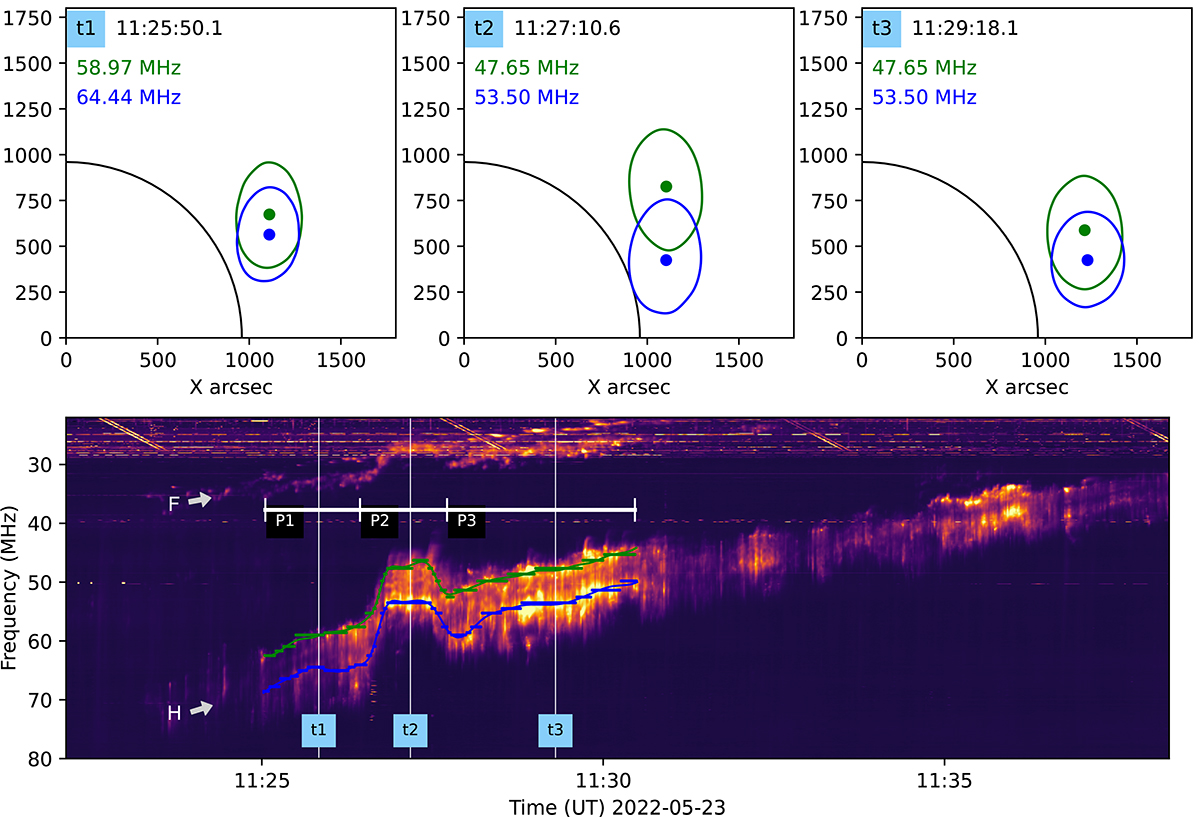
Fig. 1.
Download original image
Dynamic spectrum and imaging of three time-points in the type II radio burst. Blue represents the higher-frequency lane. The upper three panels show the source size and location at these three times, the dot marks the peak location, and the solid line marks the half-maximum contour. The solid black lines in the upper panel represent the solar disk. The lower panel shows the dynamic spectrum; the solid green and blue lines mark the upper and lower lane of the burst. The white horizontal lines mark the three phases of the burst: before the bump (P1), during the bump (P2), and after the bump (P3). The imaging of the three time slots (t1, t2, and t3) is presented in the upper three panels. F and H mark the fundamental and harmonic components in the dynamic spectrum. A related movie is available online.
Current usage metrics show cumulative count of Article Views (full-text article views including HTML views, PDF and ePub downloads, according to the available data) and Abstracts Views on Vision4Press platform.
Data correspond to usage on the plateform after 2015. The current usage metrics is available 48-96 hours after online publication and is updated daily on week days.
Initial download of the metrics may take a while.