Fig. 8.
Download original image
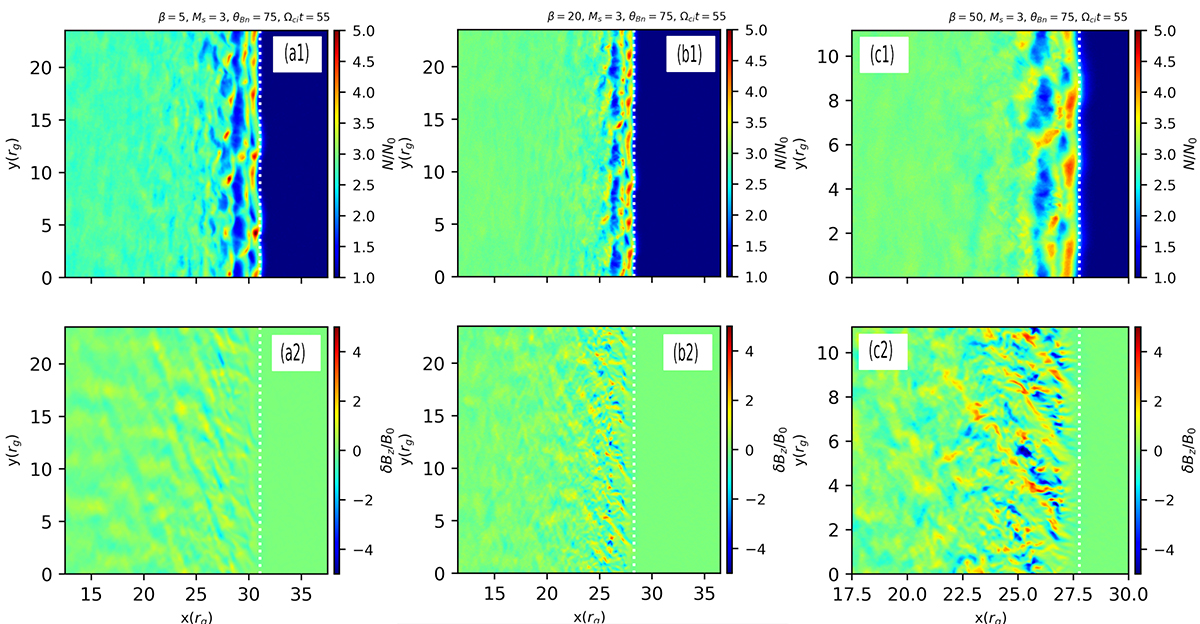
Structure of shocks with Ms = 3 and θBn = 75° at Ωcit = 55 for different values of plasma beta, β = 5, 20, 50, runs A2, A4, and A5 in panels a–c, respectively. Upper panels (*1) show distributions of normalized ion density, and lower panels (*2) the normalized Bz magnetic field fluctuations. The scaling is linear (compare Fig. 3c for the case with β = 20, run A4). White dotted lines depict the approximate location of the shock, xsh, with respect to which distance is calculated in Figs. 9 and 10.
Current usage metrics show cumulative count of Article Views (full-text article views including HTML views, PDF and ePub downloads, according to the available data) and Abstracts Views on Vision4Press platform.
Data correspond to usage on the plateform after 2015. The current usage metrics is available 48-96 hours after online publication and is updated daily on week days.
Initial download of the metrics may take a while.