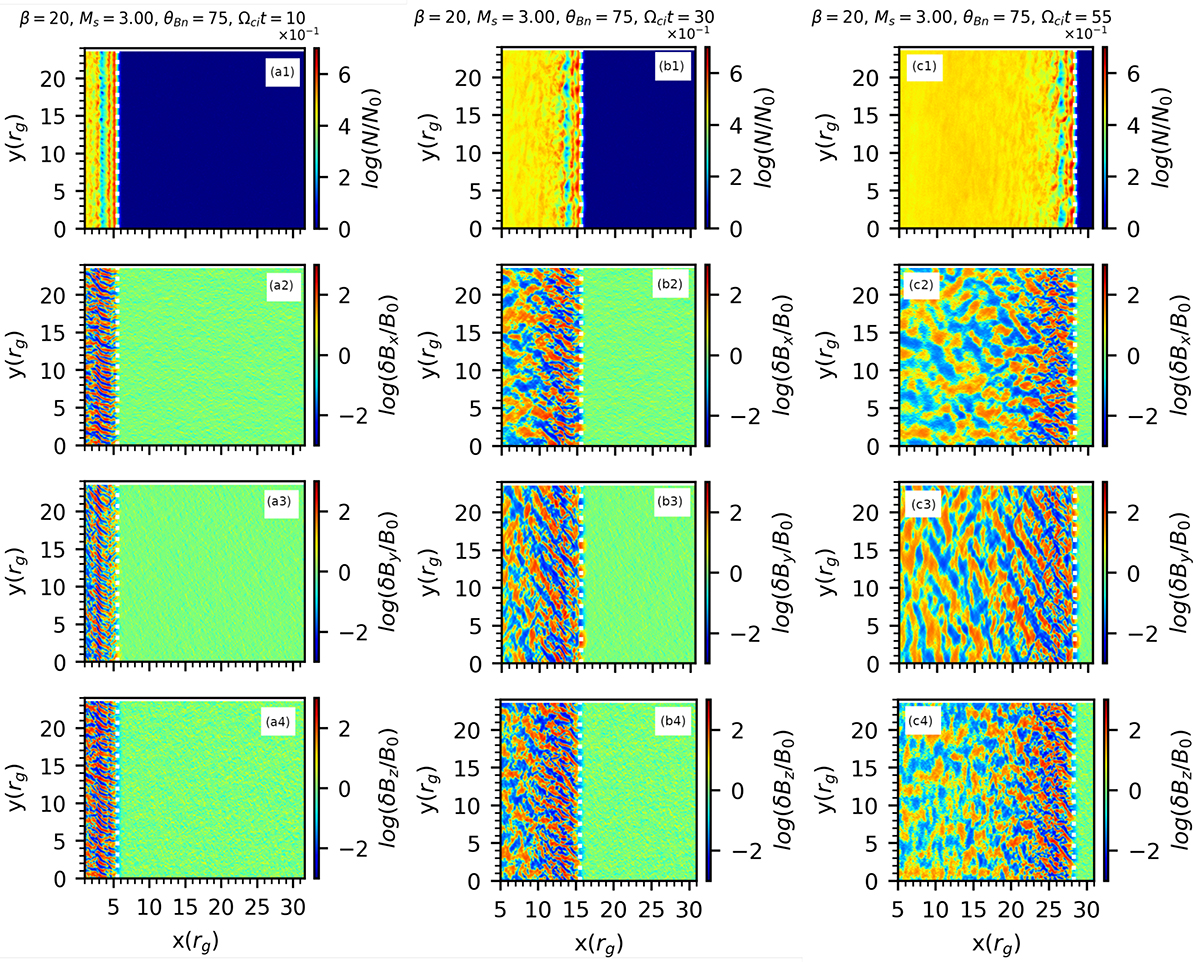
Fig. 3.
Download original image
Structure of the reference shock with Ms = 3, β = 20, and θBn = 75° (run A4) at different times Ωcit = 10 (panels a*), Ωcit = 30 (panels b*), and Ωcit = 55 (panels c*). From top to bottom, shown are the maps of the normalized ion density, Ni/N0i (panels *1), and the normalized magnetic field fluctuations (see Eqs. (8)–(10)), δBx (panels *2), δBy (panels *3), and δBz (panels *4). The scaling of all distributions is logarithmic and for the magnetic fields it is sign-preserving, and, e.g., for δBz it is: sgn(δBz)⋅{2 + log[max(|δBz|/B0, 10−2)]}. The level of “0” on the color scale hence corresponds to |δB|/B0 ≤ 10−2 (see, e.g., Kobzar et al. 2021).
Current usage metrics show cumulative count of Article Views (full-text article views including HTML views, PDF and ePub downloads, according to the available data) and Abstracts Views on Vision4Press platform.
Data correspond to usage on the plateform after 2015. The current usage metrics is available 48-96 hours after online publication and is updated daily on week days.
Initial download of the metrics may take a while.