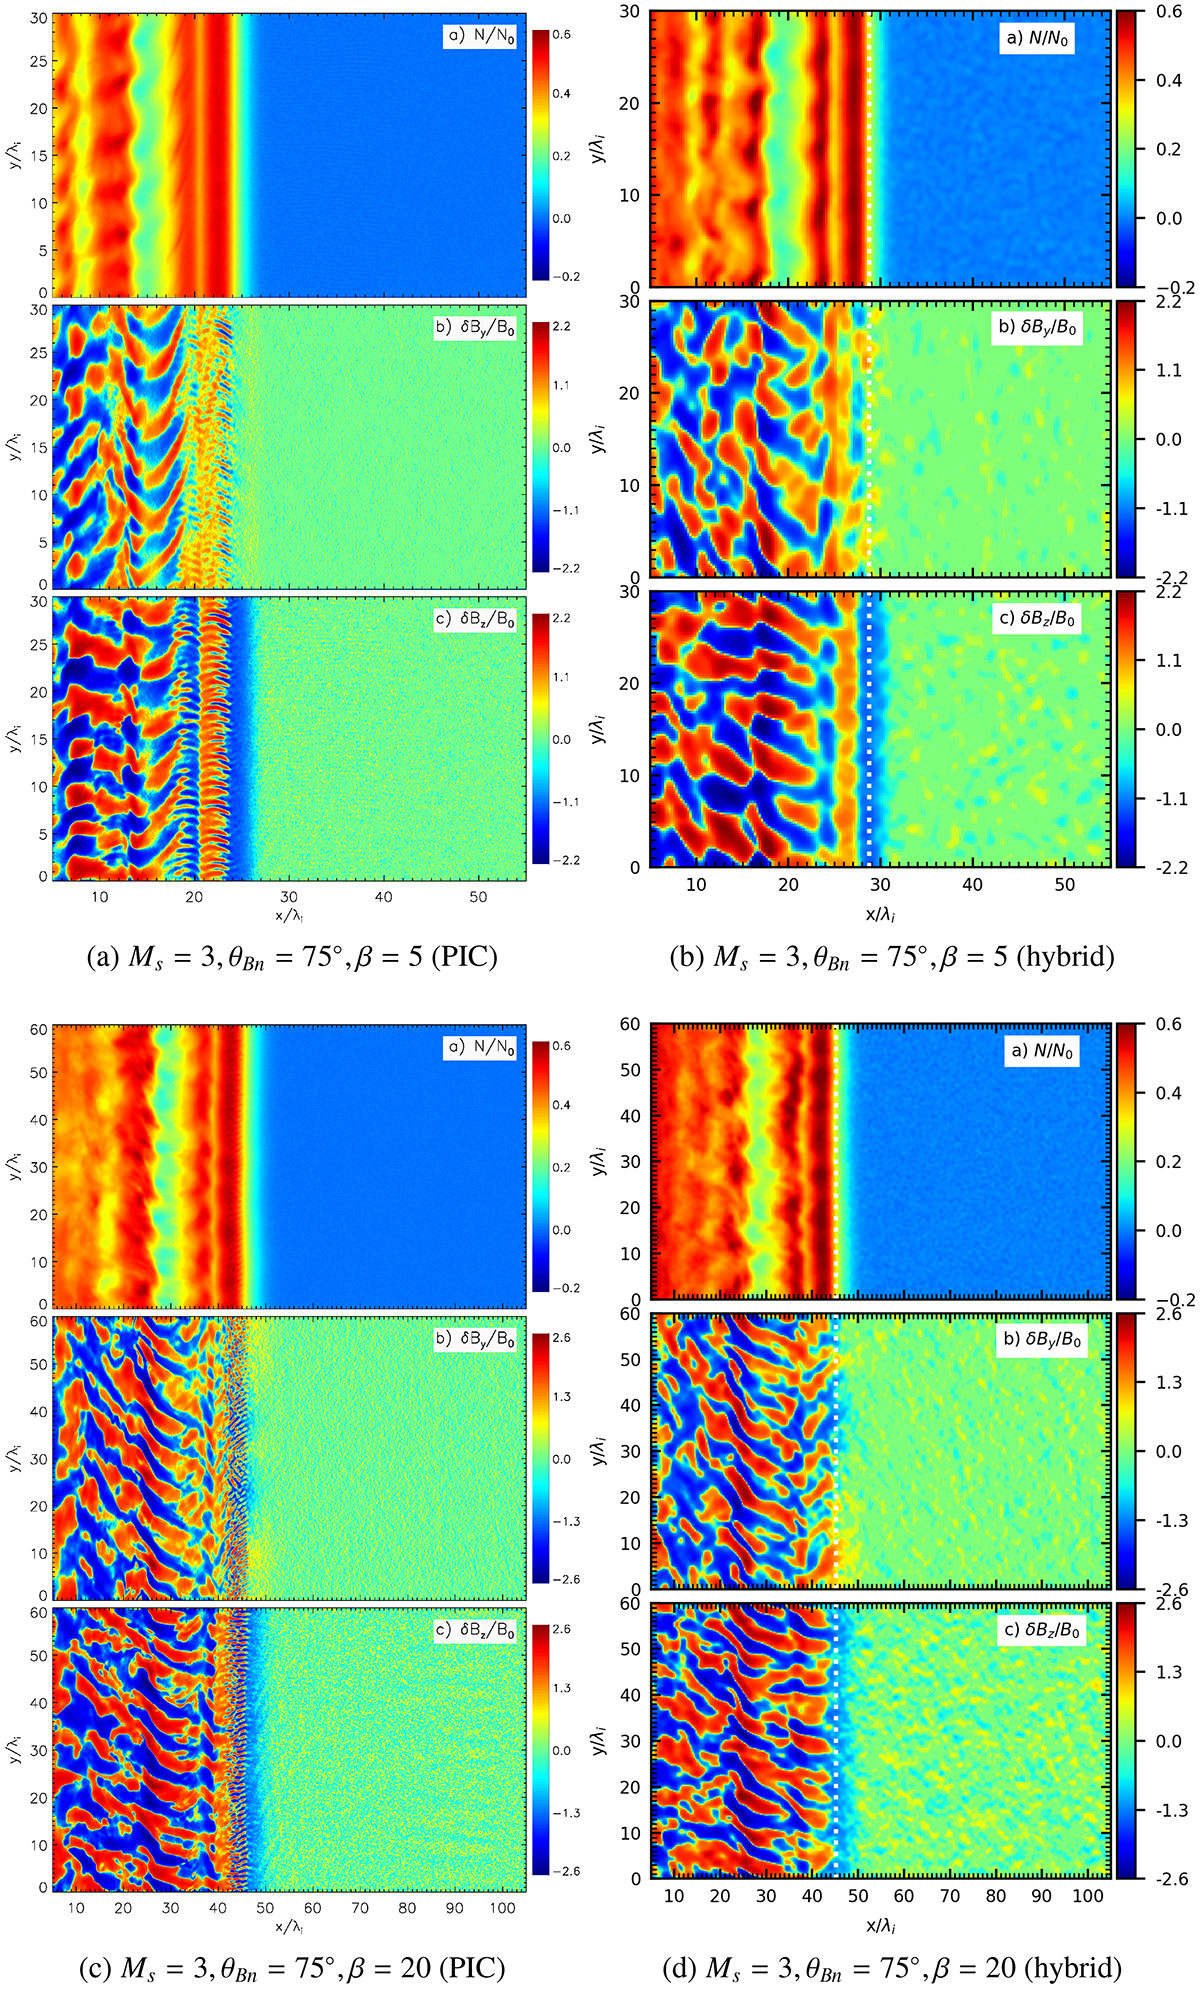
Fig. D.1.
Download original image
Comparison of the shock structures obtained with PIC (left panels) and hybrid (right panels) simulations for shocks with Ms = 3 and θBn = 75°. The top row shows results for β = 5 at time Ωcit = 10 for the PIC (a) and Ωcit = 13 for the hybrid (b) simulation (run A2). The bottom row displays the results for β = 20 at time Ωcit = 10 for the PIC (c) and Ωcit = 11 for the hybrid (d) simulation (run A4). In each panel, from top to bottom, normalized distributions of ion density, and δBy and δBz magnetic field fluctuations are shown. We note that the scaling of all distributions is logarithmic (see Fig. 3). Only portions of the computational boxes are shown for hybrid simulation runs A2 and A4.
Current usage metrics show cumulative count of Article Views (full-text article views including HTML views, PDF and ePub downloads, according to the available data) and Abstracts Views on Vision4Press platform.
Data correspond to usage on the plateform after 2015. The current usage metrics is available 48-96 hours after online publication and is updated daily on week days.
Initial download of the metrics may take a while.