Fig. 1.
Download original image
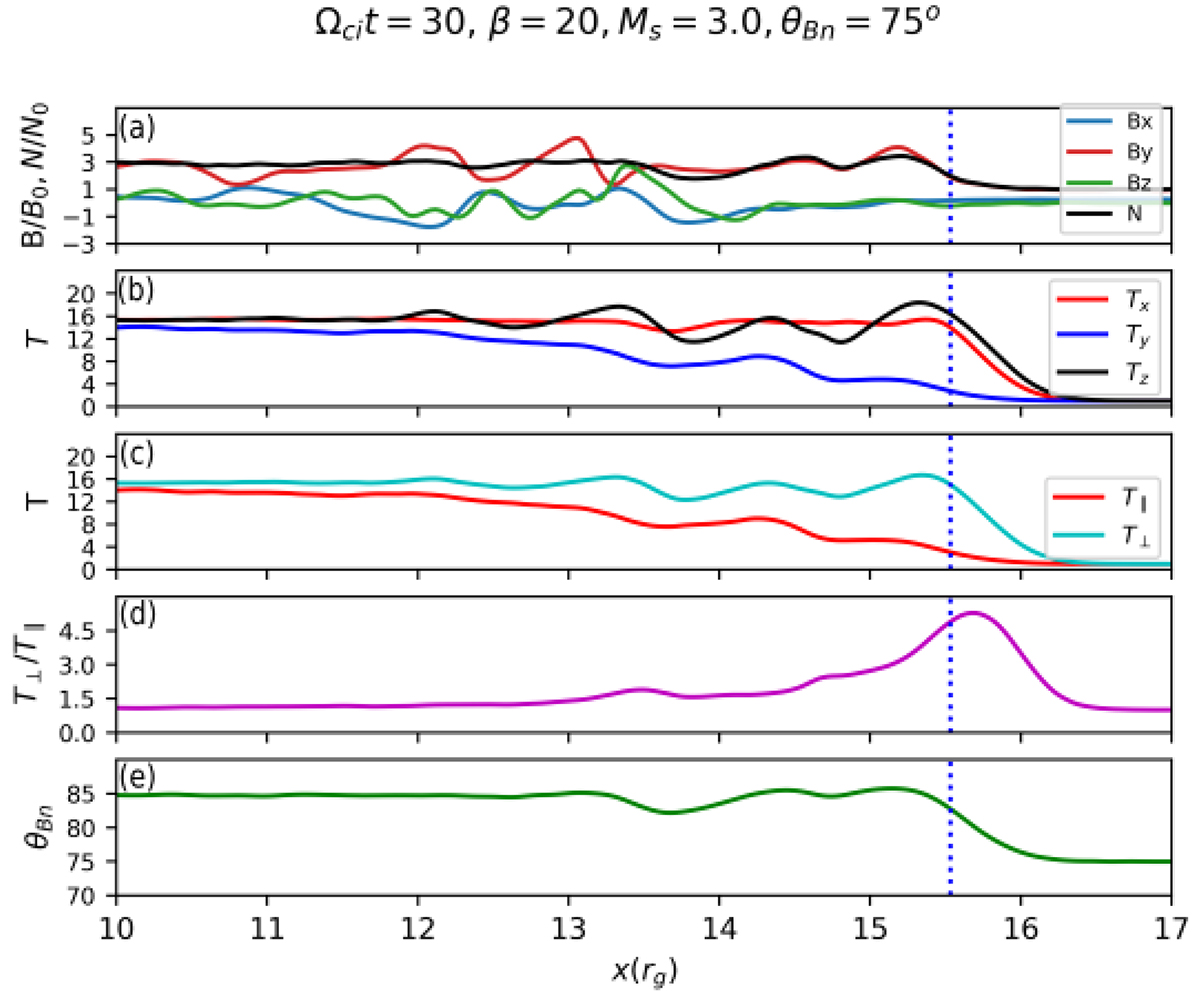
Structure of the reference shock with Ms = 3, β = 20, and θBn = 75° (run A4) at time Ωcit = 30. Displayed are the y-averaged profiles of (a) the ion density normalized to the far upstream density N0i (black line), Bx, By and Bz magnetic field components normalized to their upstream values (blue, red, and green lines, respectively), (b) profiles of Tx, Ty, and Tz temperature components (red, blue, and black lines, respectively), and (c) the components parallel, T∥ (red line), and perpendicular, T⊥ (cyan line), to the local magnetic field, normalized to T0, (d) the T⊥/T∥ temperature ratio, and (e) the mean magnetic field inclination angle with respect to the shock normal, θBn. The vertical dotted line in each panel marks the shock location. The x coordinate is normalized to the ion gyroradius rg.
Current usage metrics show cumulative count of Article Views (full-text article views including HTML views, PDF and ePub downloads, according to the available data) and Abstracts Views on Vision4Press platform.
Data correspond to usage on the plateform after 2015. The current usage metrics is available 48-96 hours after online publication and is updated daily on week days.
Initial download of the metrics may take a while.