Fig. 24
Download original image
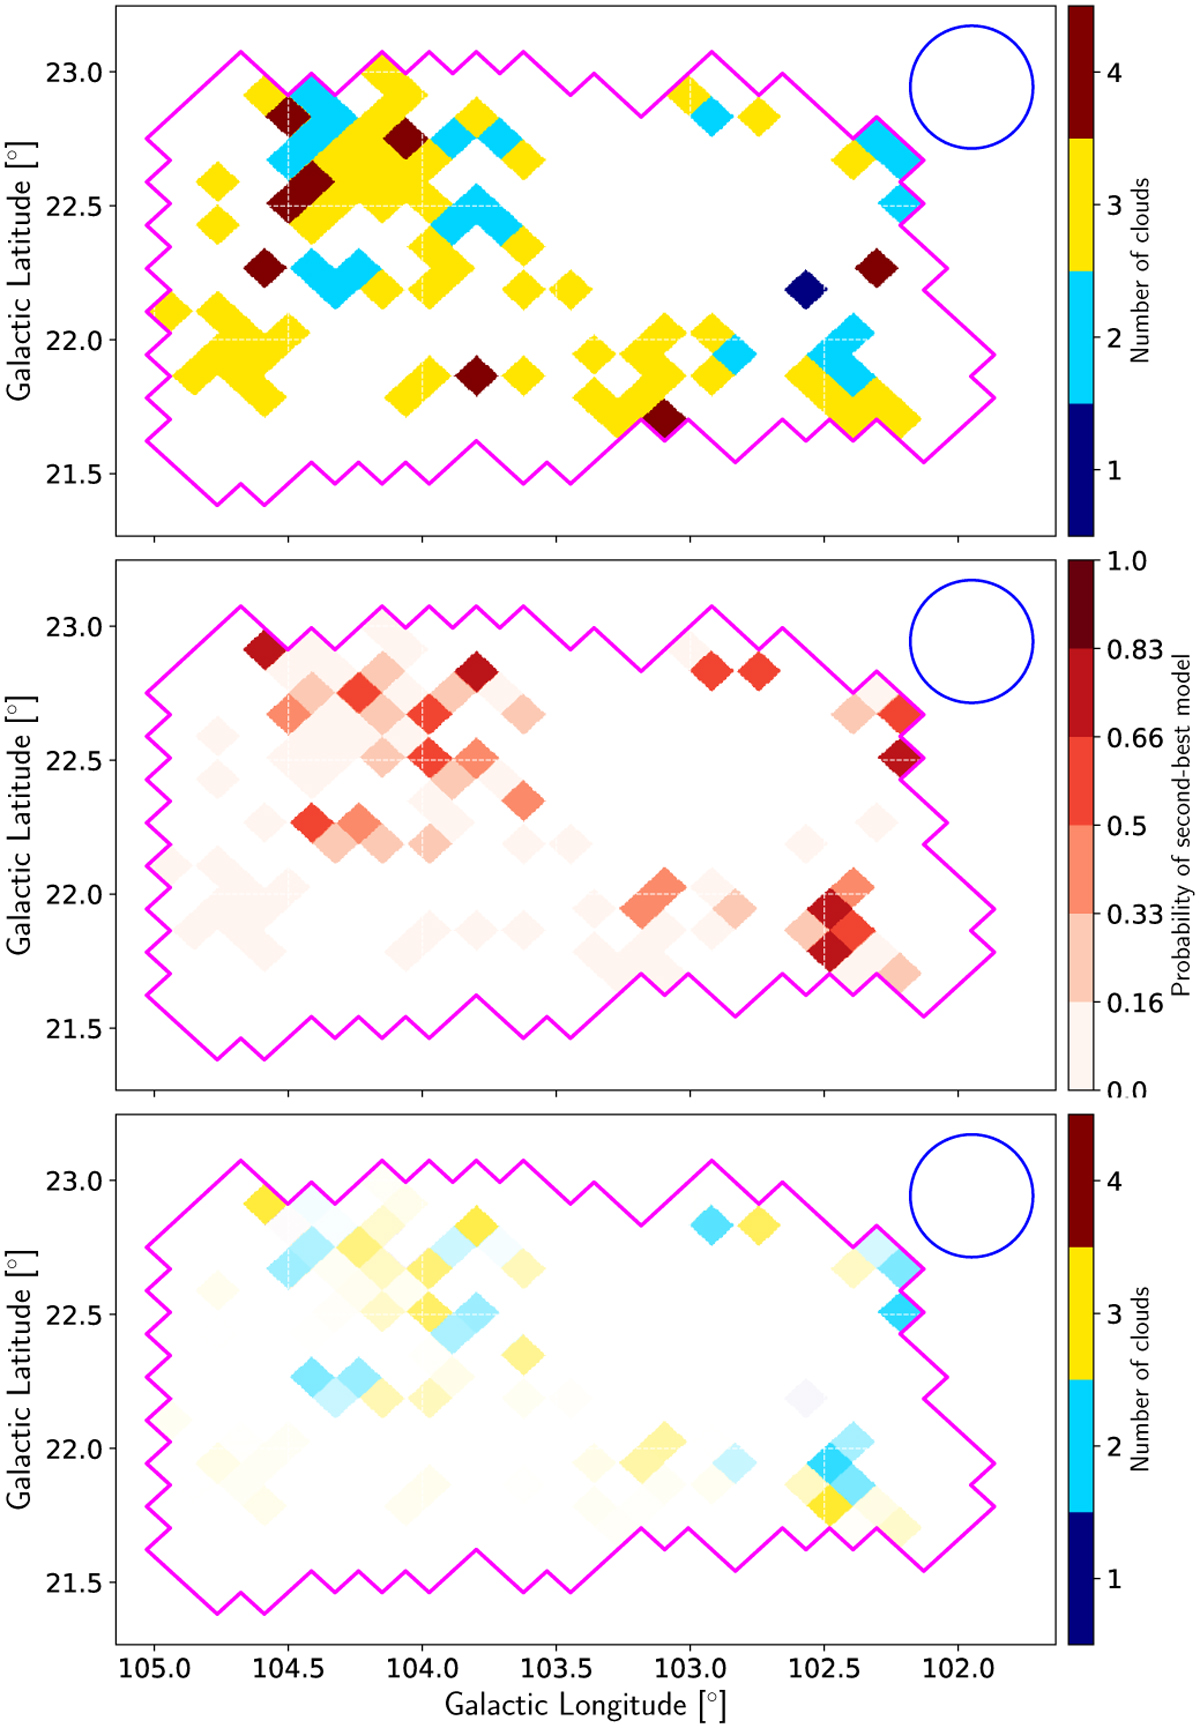
Maps of the second-best model: (top) number of clouds and (middle) probability for the second-best model to be the model that minimizes the loss of information against the best model. The bottom panel combines the information from the two upper panels. It indicates the number of clouds (color) whose opacity is given by the probability. Transparent pixels correspond to low probabilities for second-best models.
Current usage metrics show cumulative count of Article Views (full-text article views including HTML views, PDF and ePub downloads, according to the available data) and Abstracts Views on Vision4Press platform.
Data correspond to usage on the plateform after 2015. The current usage metrics is available 48-96 hours after online publication and is updated daily on week days.
Initial download of the metrics may take a while.