Fig. 23
Download original image
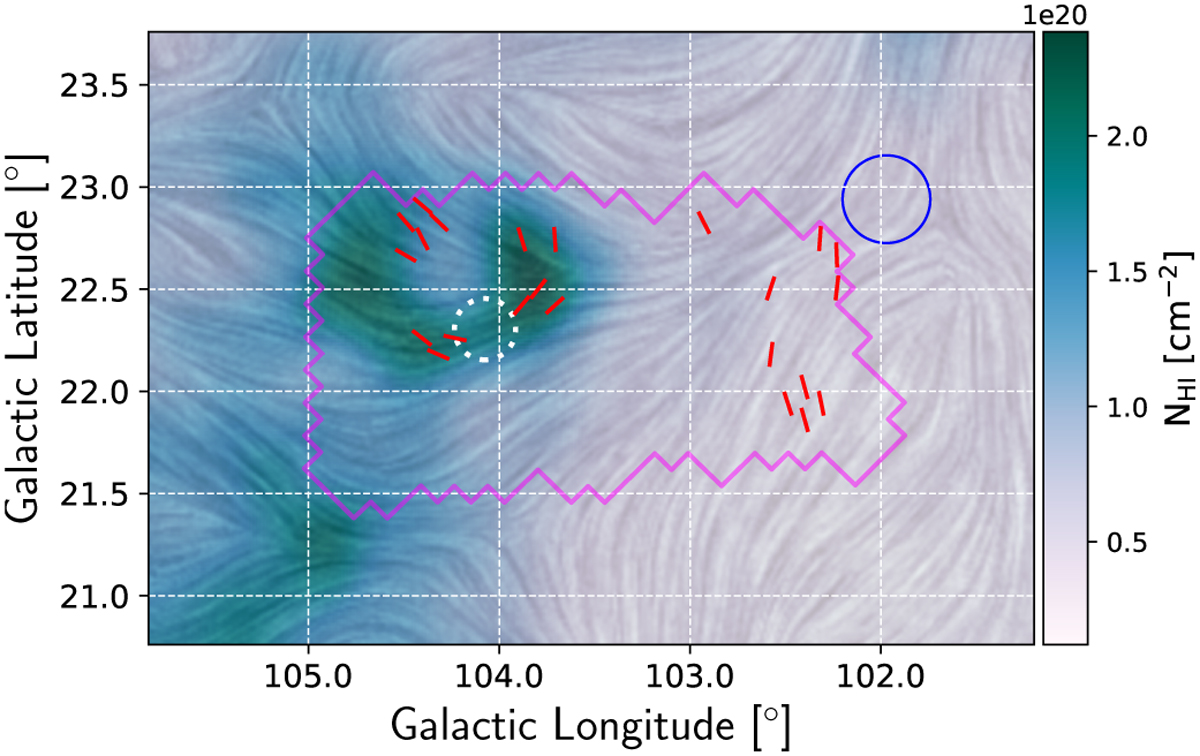
H I-orientation data integrated in the velocity range vLSR ∈ [−60.45, −44.99] km s−1 toward our surveyed area. The background color shows the H I intensity on a linear stretch, and the texture represents the POS magnetic field orientation inferred from HI fibers. The red segments indicate the mean POS magnetic field orientation obtained from starlight polarization tomography for clouds with distances larger than 1 kpc, as in Fig. 16. The white-dotted circle shows the “2-cloud region” studied in Panopoulou et al. (2019). The magenta contour and the blue circle are as in Fig. 10.
Current usage metrics show cumulative count of Article Views (full-text article views including HTML views, PDF and ePub downloads, according to the available data) and Abstracts Views on Vision4Press platform.
Data correspond to usage on the plateform after 2015. The current usage metrics is available 48-96 hours after online publication and is updated daily on week days.
Initial download of the metrics may take a while.