Fig. 21
Download original image
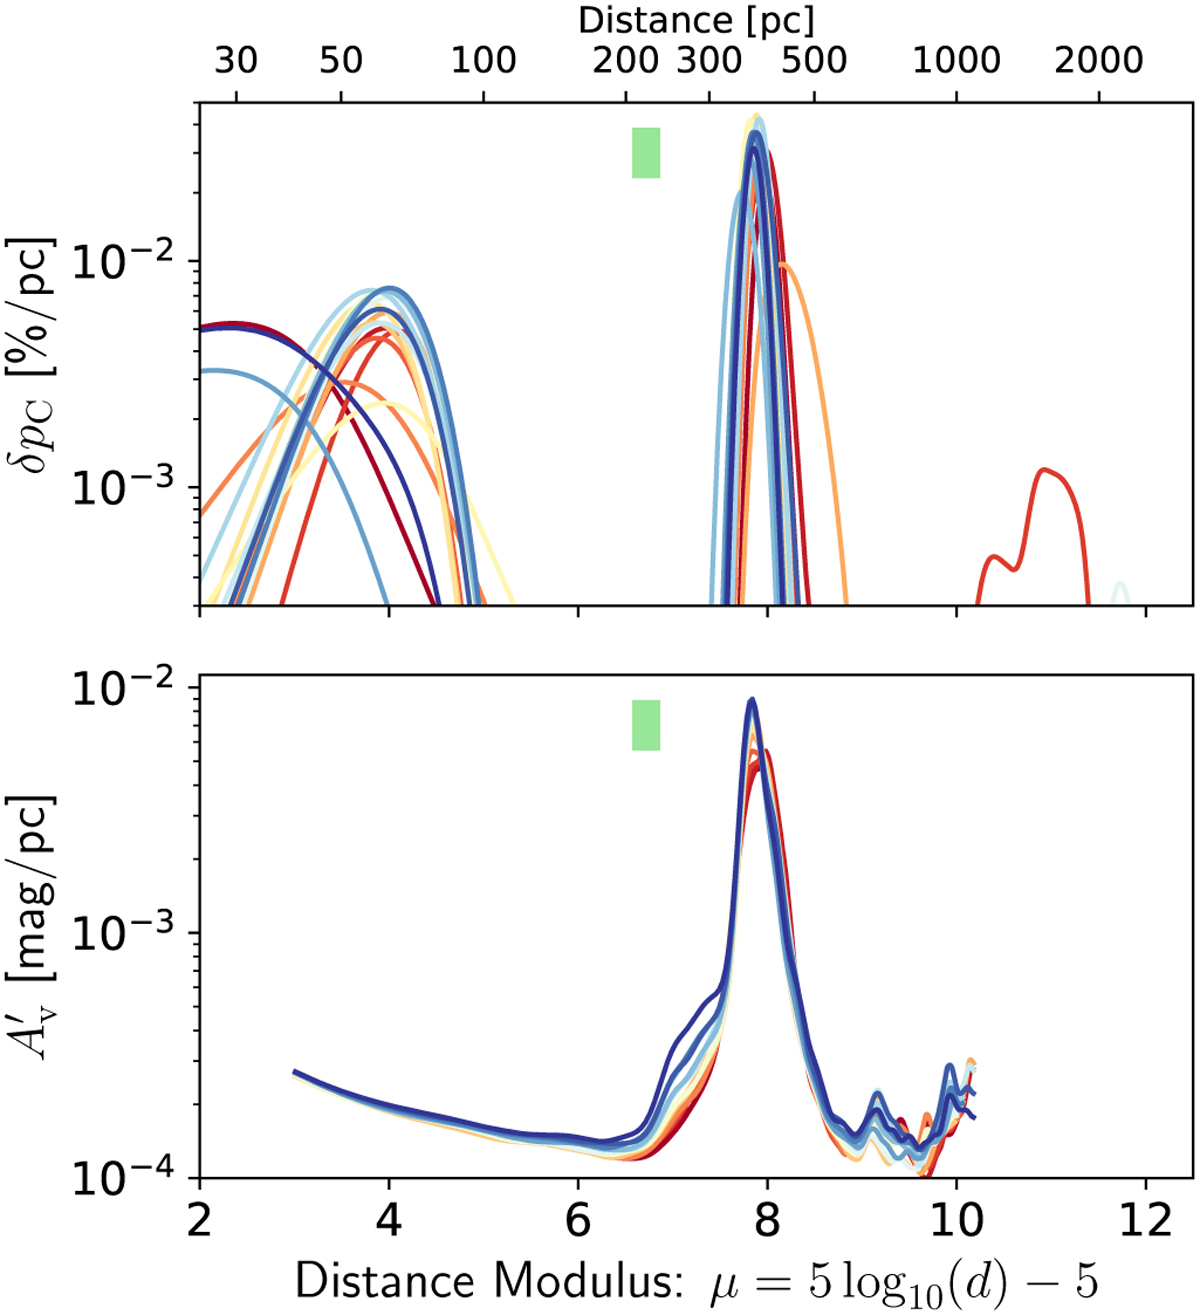
Qualitative comparison of distance profiles between dust polarization and dust extinction tomography results. Top: profiles of the “differential” of the degree of polarization (δpC, computed locally from δqC and δuC) as a function of distance modulus as inferred from our polarization 3D map. Bottom: differential extinction ![]() as a function of distance modulus as inferred from the 3D extinction map of Vergely et al. (2022). No extinction data is available at distance larger than about 1 kpc. The surveyed sky area is sampled according to an HEALPix map with Nside = 128. Each LOS is represented with a different color, the same color is used across panels. The green vertical strip indicates the range of distances to the inner surface of the Local Bubble in this sky area (Pelgrims et al. 2020).
as a function of distance modulus as inferred from the 3D extinction map of Vergely et al. (2022). No extinction data is available at distance larger than about 1 kpc. The surveyed sky area is sampled according to an HEALPix map with Nside = 128. Each LOS is represented with a different color, the same color is used across panels. The green vertical strip indicates the range of distances to the inner surface of the Local Bubble in this sky area (Pelgrims et al. 2020).
Current usage metrics show cumulative count of Article Views (full-text article views including HTML views, PDF and ePub downloads, according to the available data) and Abstracts Views on Vision4Press platform.
Data correspond to usage on the plateform after 2015. The current usage metrics is available 48-96 hours after online publication and is updated daily on week days.
Initial download of the metrics may take a while.