Fig. 20
Download original image
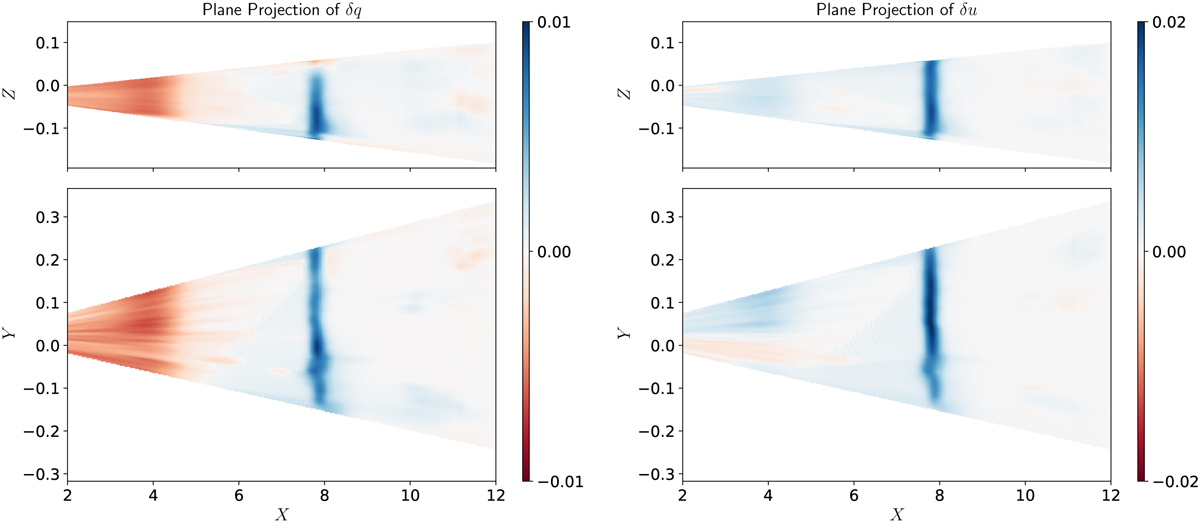
Plane projections of δq (left) and δu (right) in the vertical (top) and horizontal (bottom) planes. The vertical and horizontal planes are defined by averaging the data cubes (rectangular pyramid) in the Cartesian grid along the Y-axis and the Z-axis, respectively. The observer (us) is on the left and distance increases to the right. In order to visualize faint features, the color values (c) are obtained from the projected values (v) as ![]() · The units of the color scale are therefore
· The units of the color scale are therefore ![]() . The color scales are symmetrical about zero and the range of δu is twice as large as that of δq, reflecting the difference in magnitude of the two quantities that is observed in Fig. 18.
. The color scales are symmetrical about zero and the range of δu is twice as large as that of δq, reflecting the difference in magnitude of the two quantities that is observed in Fig. 18.
Current usage metrics show cumulative count of Article Views (full-text article views including HTML views, PDF and ePub downloads, according to the available data) and Abstracts Views on Vision4Press platform.
Data correspond to usage on the plateform after 2015. The current usage metrics is available 48-96 hours after online publication and is updated daily on week days.
Initial download of the metrics may take a while.