Fig. 2
Download original image
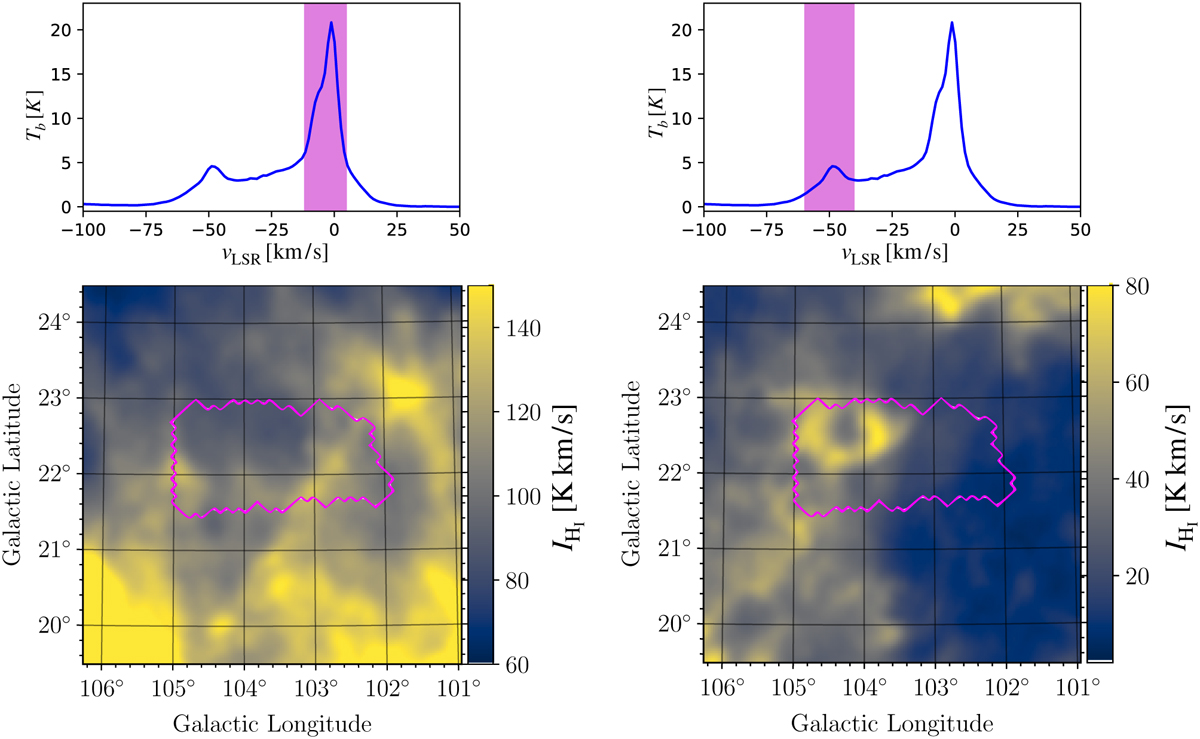
H I velocity data from the HI4PI survey in the sky area toward the region surveyed in starlight polarization. The top panels show the brightness temperature as a function of the gas velocity measured in the LSR. The blue spectrum corresponds to the velocity spectrum averaged over the full region. Two dominant peaks with velocities in the LVC (≈ − 1 km s−1) and IVC (≈ − 50 km s−1) ranges are seen. The bottom panels show the column density maps resulting from the integration of the velocity spectra in the ranges depicted by shaded regions marked in the top panels in the LVC (left) and IVC (right) ranges. The maps reveal a high degree of complexity in morphological structures. The magenta outline indicates the sky region of 3.8 sq. deg. for which starlight-polarization-based tomography is obtained in this work (see Sect. 3.4).
Current usage metrics show cumulative count of Article Views (full-text article views including HTML views, PDF and ePub downloads, according to the available data) and Abstracts Views on Vision4Press platform.
Data correspond to usage on the plateform after 2015. The current usage metrics is available 48-96 hours after online publication and is updated daily on week days.
Initial download of the metrics may take a while.